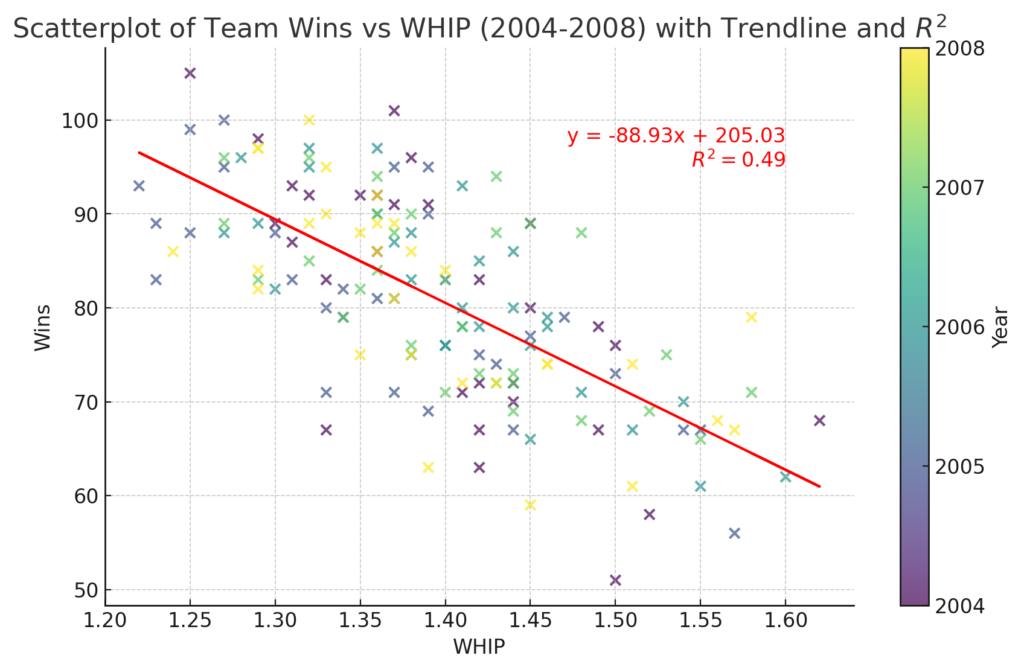
This scatterplot visualizes the relationship between a baseball team’s WHIP (Walks plus Hits per Inning Pitched) and the number of wins they achieved during the seasons from 2004 to 2008. I included both the AL and NL in this analysis. Each point on the graph represents a team in a specific year, with the color indicating the corresponding season. The WHIP is plotted on the x-axis, while the number of wins is plotted on the y-axis. This visualization allows us to observe if there is a pattern or trend between these two variables across different years.
A trendline, represented by a solid red line, has been added to the scatterplot, which provides a general indication of the relationship between WHIP and wins. The slope of the line suggests that as WHIP increases, the number of wins tends to decrease. The strength of this relationship is indicated by the R-squared value of 0.49, meaning that WHIP accounts for approximately 49% of the variability in the number of wins. This moderate R-squared value suggests a fairly significant correlation between the two variables.
In summary, the scatterplot illustrates a moderate negative correlation between WHIP and team wins, indicating that WHIP is a meaningful factor in a team’s success, though not the sole determinant. Including both leagues from 2004 to 2008 allows for an interesting, if limited, analysis over multiple seasons, with the trendline and R-squared value providing insights into the overall pattern between these two metrics. This plot highlights the importance of WHIP in predicting team performance while suggesting that other factors certainly contribute to a team’s total wins.
Here is a scatterplot illustrating wins in terms of team ERA (earned run average). When I was a kid, I didn’t think ERA was very valuable, and the following plot shows that it has less explanatory value than WHIP.
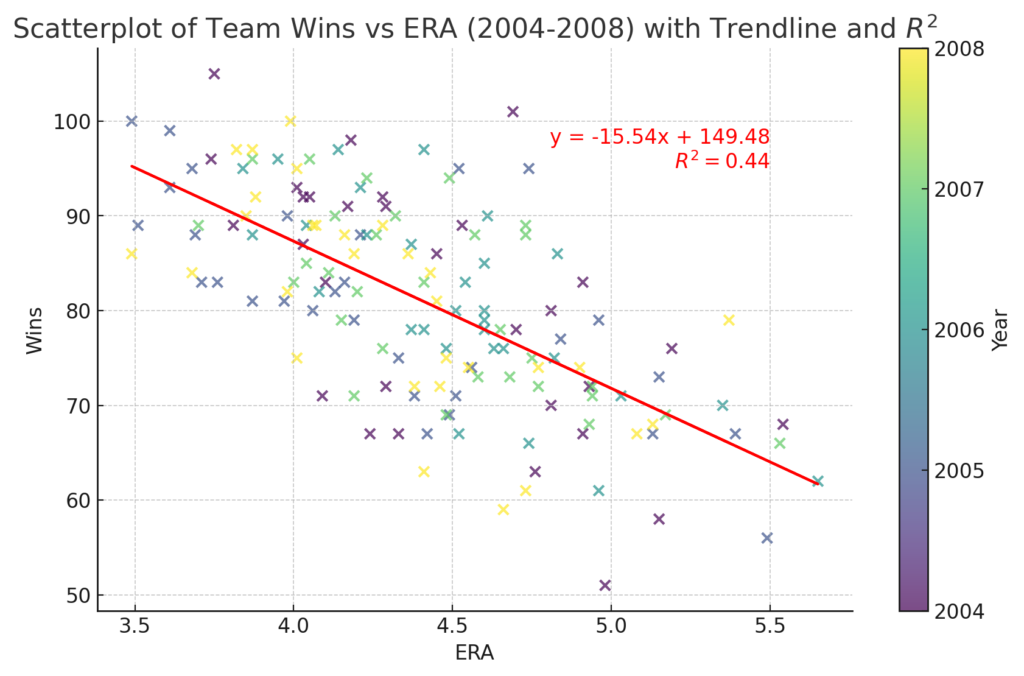
As we saw in a previous post, payroll differences explained approximately 19 percent of the variability in win totals. Team ERA explains about 44 percent of the variability, while the WHIP metric has more explanatory value (49 percent) when determining what leads to wins in major league baseball. I will keep posting more information as my research progresses.
![]()