In baseball, a catcher’s Pop Time can be the difference between catching a base-stealer and letting them slide in safely. Pop Time measures how quickly a catcher transfers the ball from their mitt to second base, factoring in the catcher’s footwork, exchange, and arm strength. This metric provides a more comprehensive assessment of a catcher’s defensive capabilities than arm strength alone, making it crucial in evaluating how effectively a catcher can control the running game.
This post explores the distribution of pop times among various MLB catchers, with visualizations such as a histogram, Kernel Density Estimate (KDE) plot, violin plot, and box plot. We’ll also examine some key summary statistics and update the analysis with the best pop times recorded during the 2023 season.
What is Pop Time?
Pop Time is the time it takes for a catcher to throw the ball to second base during a steal or pickoff attempt. It measures the time elapsed from when the pitch hits the catcher’s mitt to when the throw reaches the center of the base. MLB’s average pop time for a throw to second base is 2.01 seconds, but elite catchers are significantly faster.
Pop Time considers three main factors:
- Footwork: The catcher’s ability to quickly get into a throwing position.
- Exchange: How fast the catcher transfers the ball from the glove to the throwing hand.
- Arm Strength: The velocity and speed of the throw.
Catchers with exceptional Pop Times obviously offer a much higher probability of recording an out.
Best Pop Times from 2023
Below are the best average Pop Times to second base on stolen-base attempts (minimum 15 SB attempts) from the 2023 MLB season:
- J.T. Realmuto: 1.90 seconds
- Yan Gomes: 1.93 seconds
- Jorge Alfaro: 1.94 seconds
- Austin Hedges: 1.94 seconds
- Manny Piña: 1.94 seconds
- Gary Sánchez: 1.94 seconds
These elite catchers consistently post Pop Times well below the league average, making them highly effective at throwing out would-be base stealers. J.T. Realmuto, whose reputation proceeds him, leads the pack with an impressive 1.90 seconds.
Pop Time Distribution: A Closer Look
To better understand how Pop Times vary among catchers, I visualized the distribution using a histogram:
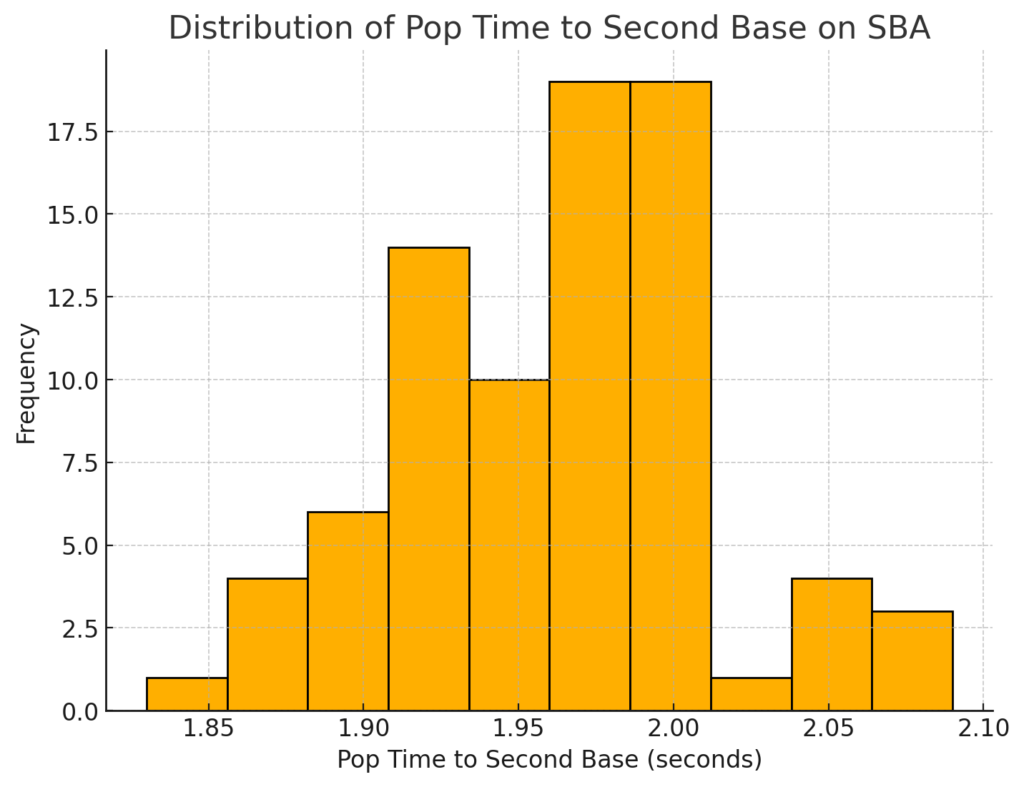 The histogram shows that most catchers’ Pop Times cluster around 1.95–2.0 seconds, with very few recording times below 1.90 seconds. The majority of catchers are near the league average of 2.01 seconds, but the elite catchers separate themselves by consistently being faster than this threshold.
Kernel Density Estimate (KDE) Plot
A Kernel Density Estimate (KDE) plot smooths out the distribution to provide a clearer picture of the underlying trends:
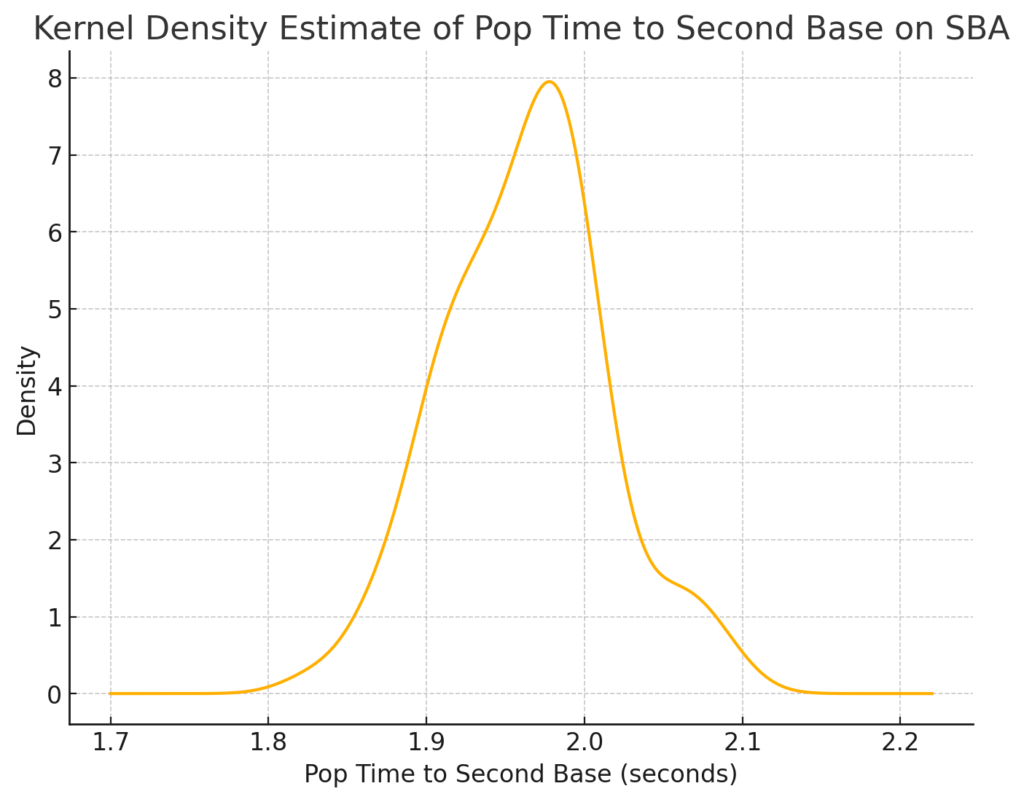 The KDE plot highlights the peak of Pop Times around 1.95 seconds, confirming that most catchers perform near this time. The data skews slightly to the right, indicating that a few catchers have slower pop times exceeding 2.0 seconds, but most fall below this threshold.
Violin Plot: Visualizing Distribution and Density
I also created a violin plot, which combines the features of a KDE and a box plot to visualize both the distribution and the density of pop times:
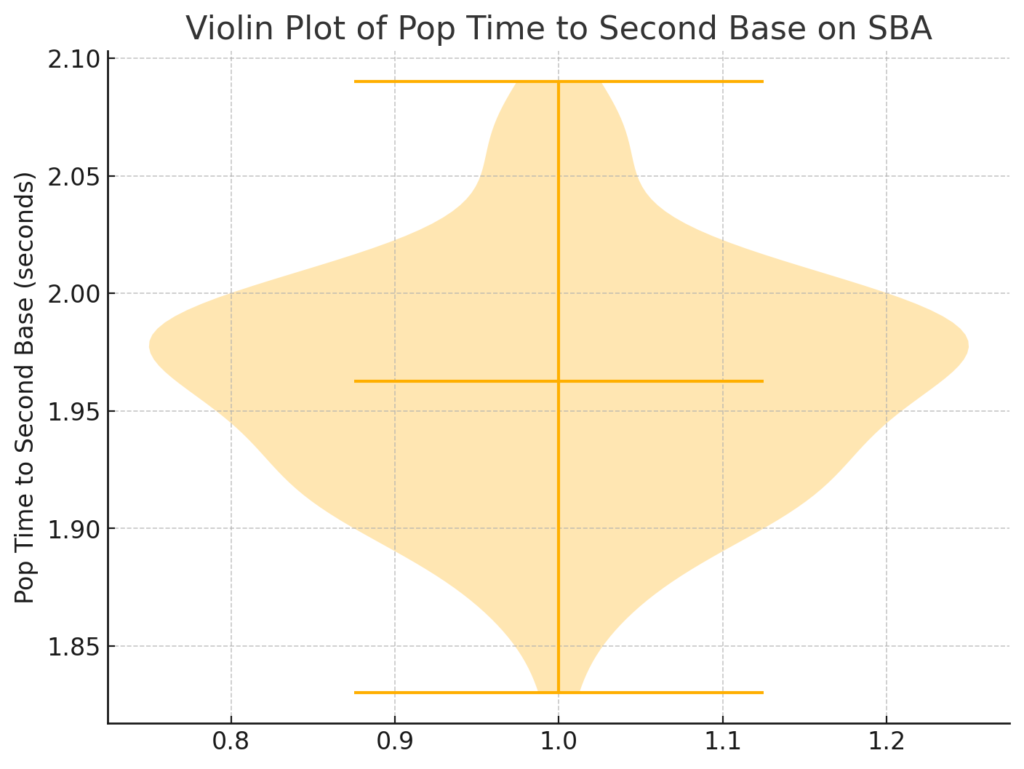 The violin plot shows that most catchers fall within a narrow range of 1.90 to 2.00 seconds. The distribution is dense around 1.95 seconds, with fewer catchers having significantly faster or slower times. This plot also highlights that catchers like J.T. Realmuto are outliers, excelling well beyond the typical range.
Box Plot: Highlighting Key Statistics
The box plot below offers a simple yet informative view of the data, focusing on the central tendency and spread of Pop Times:
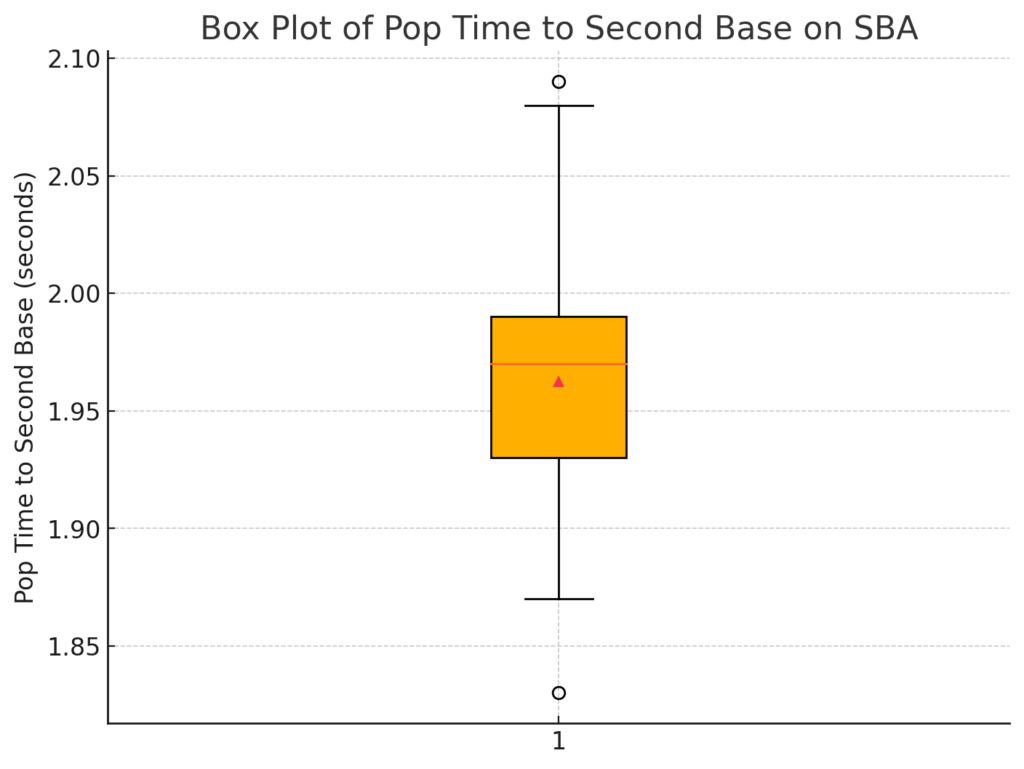
Key points from the box plot:
- Median Pop Time: 1.97 seconds
- Interquartile Range (IQR): Most pop times fall between 1.93 and 1.99 seconds.
- Outliers: A few catchers have slower times above 2.0 seconds, but these are rare.
Summary Statistics
The summary statistics for Pop Times further illustrate how closely clustered most catchers are around the league average:
- Mean Pop Time: 1.96 seconds
- Standard Deviation: 0.051 seconds (indicating low variability)
- Minimum Pop Time: 1.83 seconds
- Maximum Pop Time: 2.09 seconds
- 25th Percentile: 1.93 seconds
- 50th Percentile (Median): 1.97 seconds
- 75th Percentile: 1.99 seconds
These statistics show that most catchers perform within a narrow band, with the elite catchers falling below 1.90 seconds.
Conclusion
Pop Time is a critical metric for evaluating a catcher’s ability to control the running game. While arm strength is important, Pop Time provides a fuller picture by incorporating footwork and exchange speed. This type of analysis also lets us ignore the pitcher and focus exclusively on the catcher’s skills.
Our analysis of Pop Times using visual tools like histograms, KDE plots, violin plots, and box plots shows that most catchers fall within a narrow range of 1.95 to 2.0 seconds, with a few standout performers excelling beyond this. The data from the 2023 season illustrates how slight differences in Pop Time can significantly impact a catcher’s effectiveness at throwing out base stealers.
For catchers, a fast Pop Time can be the difference between a successful defensive play and allowing the opposing team to gain momentum on the bases. I hope you are enjoying this deep dive into the nuances of catching; I certainly am. It is fascinating, isn’t it?
![]()