Introduction
When I think about baseball, arm strength is one of the first things that comes to mind—especially when comparing players across different positions. Whether it’s a third baseman making a quick throw across the diamond (Brooks Robinson, anyone?) or an outfielder firing a rocket from the warning track (Roberto Clemente was awesome), a strong and accurate arm can make all the difference. Recently, I dove into some data from Major League Baseball covering the years 2020 to 2024 to better understand how arm strength varies by position, and I’d like to share what I found.
Comparing Average Arm Strength Across Positions
I started by looking at the average arm strength for each position. Unsurprisingly, outfielders—particularly those in right field—have the strongest arms, while positions like first base require less power behind the throw.
This bar chart shows the average arm strength for each position (excluding catcher) in miles per hour. Outfielders (RF, CF, LF) clearly lead the way, with center fielders and right fielders consistently throwing the hardest. It makes sense: outfielders must make long throws back into the infield, often in critical situations where arm strength is key.
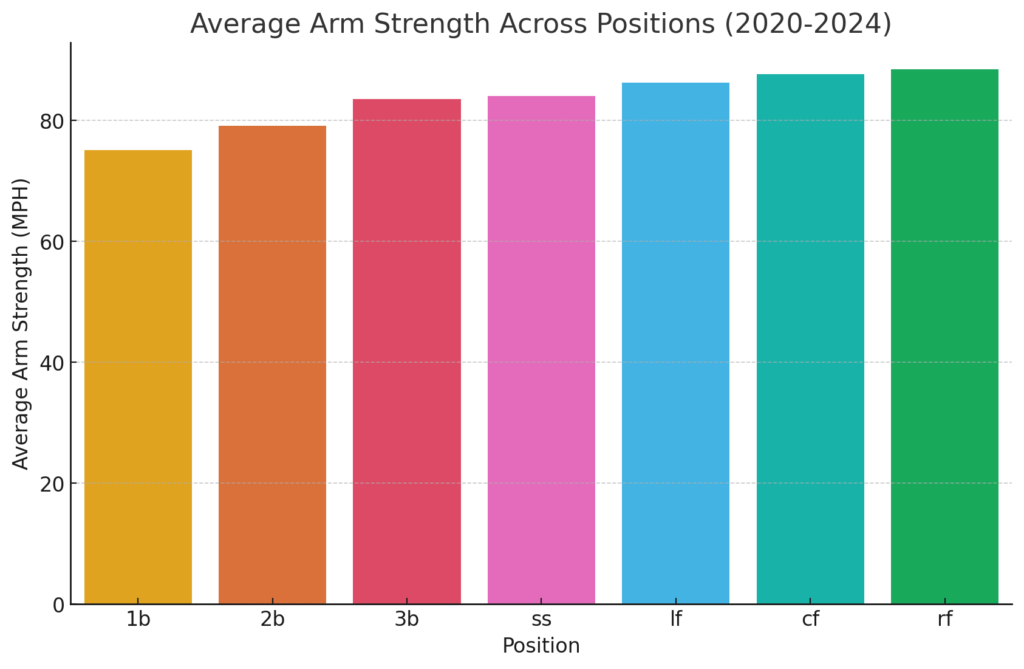
Are you surprised? I might have thought that shortstops would have edged out left fielders and maybe even center fielders. That said, it is close.
As always, box plots allow us to get a more granular view of the raw data. Here is what I found.
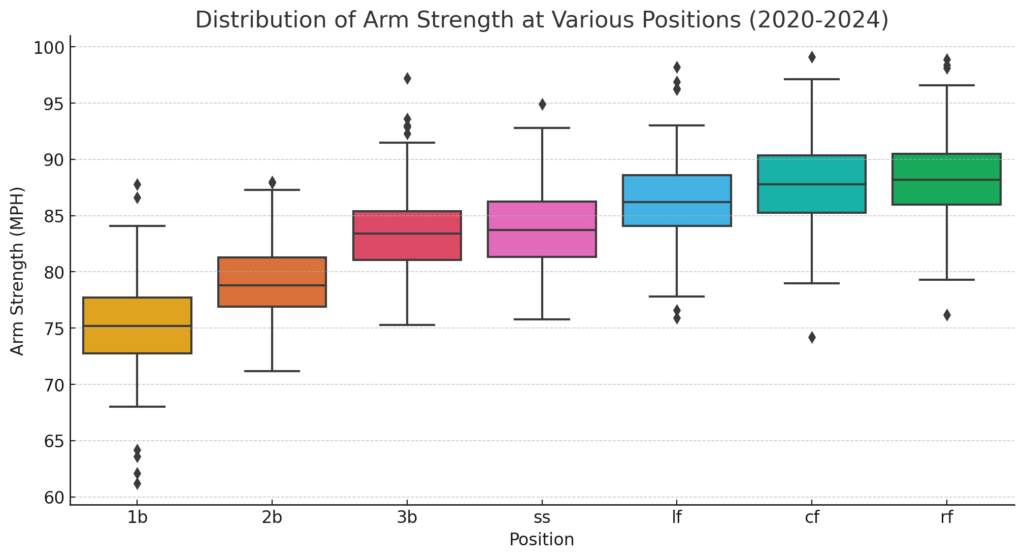
Notice the outliers among first basemen. Lots of them get very little on their throws. That is unsurprising; many players are positioned there for their offense, with defense being an afterthought.
As readers of this blog know, I have a special relationship with violin plots. Here is the same data in that form.
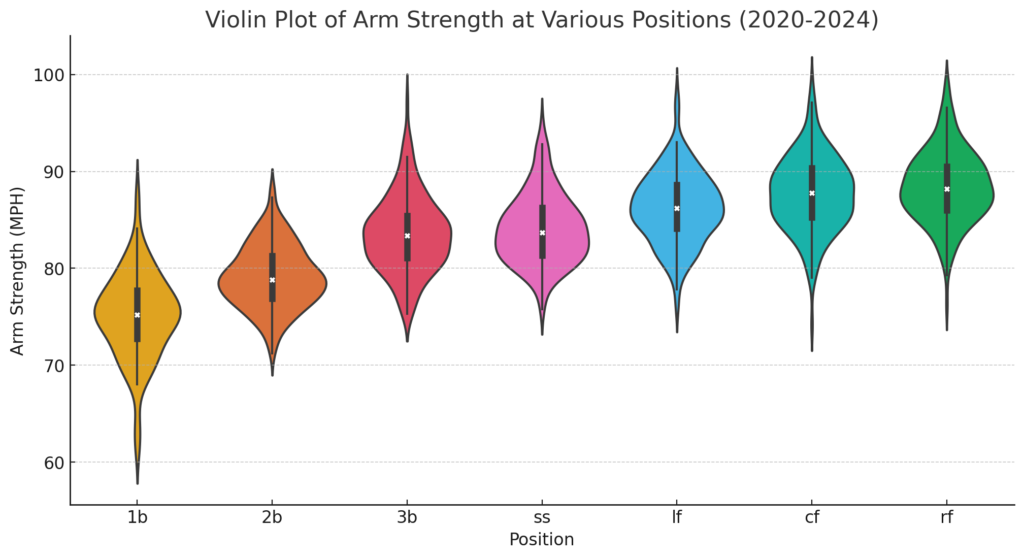
Once again, the poor arms of a select group of first basemen are highlighted. I consider that fact to be a big takeaway from this plot.
Infield vs. Outfield: A Clear Difference
Next, I wanted to break things down further and compare infielders’ arm strength versus outfielders. Unsurprisingly, outfielders, who cover more ground and make longer throws, generally have stronger arms.
The box plot below shows the distribution of arm strength between infield and outfield players. Outfielders not only have higher average arm strength, but the range of arm strength is more comprehensive, too. Some outfielders, particularly those in right field, can really get after it when a runner is rounding second.
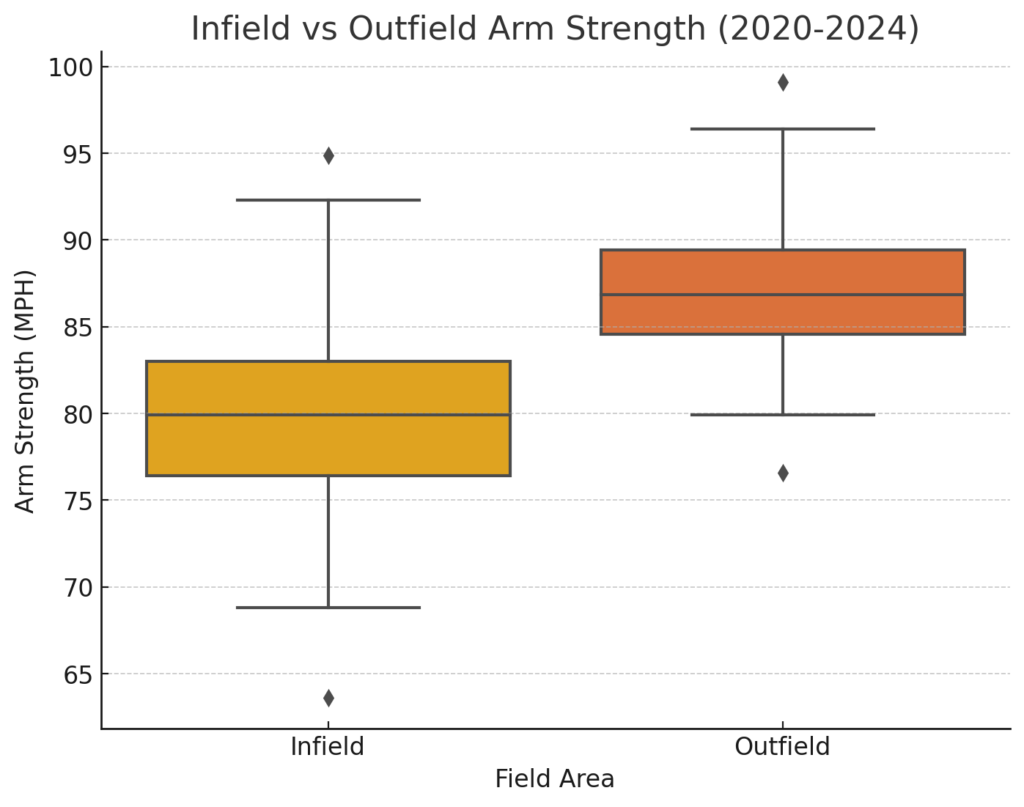
I would like to tell you something interesting about this plot. Over 35 years ago, I was taught a trick (more properly, a heuristic) at Harvard University. If there is a space between the bodies of the box plots, then the data set is worthy of further exploration. If you look closely, you can see a thin space between the boxes, so I decided to investigate further to see if the differences in arm strength are statistically significant. We will get to that in a bit.
Looking for Patterns: Correlations Between Positions
Before we get to the hard-core statistics, I wanted to explore whether there is a relationship between arm strength at different positions. For instance, do shortstops tend to have arm strength similar to that of second basemen or third basemen? To find out, I ran a correlation analysis.
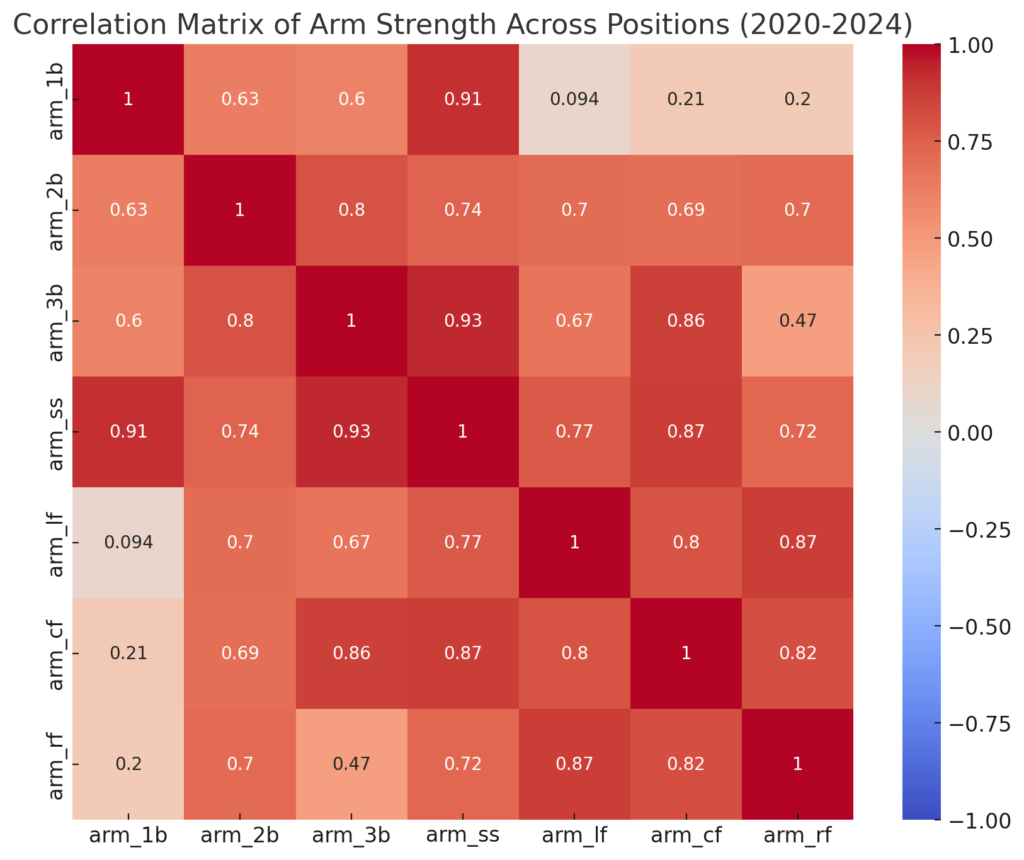
This heatmap shows how arm strength at one position correlates with another. There are some interesting patterns here—positions like second base (2B) and shortstop (SS) show a strong correlation, likely because they both require quick, strong throws in the infield. The outfield positions also show high correlations with each other, which makes sense given the similar demands placed on their arms.
Here are the Statistics
The results of the one-way ANOVA test (a comparison of variance amongst means) indicate the following:
- F-statistic: 261.67
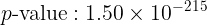
Since the p-value is extremely small (well below the typical significance and totally arbitrary threshold of 0.05), we can reject the null hypothesis. This suggests statistically significant differences in arm strength across the different positions. In other words, the differences in arm strength are authentic and valid.
I have never done this before in my blog, but I decided to take an even deeper dive into this data set. I view this blog as more or less an introduction to what I find interesting. I don’t want to get into the weeds; many blogs and websites do that. Today, though, is different. Early this morning, I ran my 4 miles despite not wanting to get out of bed. My hip, which needs to be replaced, barked the entire time. I guess I am in a mood… Here is what I did next.
| group1 | group2 | meandiff | p-adj | lower | upper | reject |
| arm_1b | arm_2b | 4.0267 | 0 | 2.746 | 5.3074 | TRUE |
| arm_1b | arm_3b | 8.4252 | 0 | 7.1 | 9.7503 | TRUE |
| arm_1b | arm_cf | 12.6281 | 0 | 11.334 | 13.9221 | TRUE |
| arm_1b | arm_lf | 11.1761 | 0 | 9.9308 | 12.4214 | TRUE |
| arm_1b | arm_rf | 13.3679 | 0 | 12.097 | 14.6388 | TRUE |
| arm_1b | arm_ss | 8.977 | 0 | 7.6278 | 10.3262 | TRUE |
| arm_2b | arm_3b | 4.3985 | 0 | 3.2266 | 5.5704 | TRUE |
| arm_2b | arm_cf | 8.6014 | 0 | 7.4647 | 9.738 | TRUE |
| arm_2b | arm_lf | 7.1494 | 0 | 6.0686 | 8.2303 | TRUE |
| arm_2b | arm_rf | 9.3412 | 0 | 8.231 | 10.4514 | TRUE |
| arm_2b | arm_ss | 4.9503 | 0 | 3.7512 | 6.1494 | TRUE |
| arm_3b | arm_cf | 4.2029 | 0 | 3.0164 | 5.3894 | TRUE |
| arm_3b | arm_lf | 2.7509 | 0 | 1.6178 | 3.8841 | TRUE |
| arm_3b | arm_rf | 4.9427 | 0 | 3.7815 | 6.1039 | TRUE |
| arm_3b | arm_ss | 0.5518 | 0.8486 | -0.6946 | 1.7983 | FALSE |
| arm_cf | arm_lf | -1.4519 | 0.0019 | -2.5486 | -0.3553 | TRUE |
| arm_cf | arm_rf | 0.7398 | 0.4534 | -0.3858 | 1.8654 | FALSE |
| arm_cf | arm_ss | -3.6511 | 0 | -4.8644 | -2.4377 | TRUE |
| arm_lf | arm_rf | 2.1918 | 0 | 1.1226 | 3.261 | TRUE |
| arm_lf | arm_ss | -2.1991 | 0 | -3.3604 | -1.0379 | TRUE |
| arm_rf | arm_ss | -4.3909 | 0 | -5.5795 | -3.2022 | TRUE |
These are the results from Tukey’s HSD (Honestly Significant Difference) test results that provide pairwise comparisons between arm strengths for different positions. Yeah, I know your eyes are glazing over, but bear with me. Here’s how to interpret the key columns:
- Group1 and Group2: These columns represent the two positions being compared. For example, “arm_1b” vs. “arm_2b” compares the arm strength of first basemen with second basemen.
- Meandiff: This column shows the difference in the average arm strength between the two groups. A positive number means the arm strength of the first group (Group1) is higher than the second group (Group2).
- For example, the mean difference between first basemen (arm_1b) and second basemen (arm_2b) is 4.03 mph, meaning first basemen tend to have lower arm strength compared to second basemen.
- p-adj: This is the adjusted p-value, which tests the statistical significance of the difference. If this value is below 0.05, it indicates that the difference is statistically significant.
- For most comparisons, the p-values are extremely low (0.0), indicating strong evidence that arm strength significantly differs between these positions.
- Lower and Upper: These are the confidence intervals for the mean difference. It provides a range within which the actual mean difference will likely fall, with a 95% confidence level.
- For example, the confidence interval for the difference between arm_1b and arm_2b is between 2.75 and 5.31 mph, suggesting that the actual difference lies within this range.
- Reject: This column tells whether the difference between the two groups is statistically significant. If it says “True,” the test rejects the null hypothesis, meaning the difference between the two positions is significant.
- In this case, “True” appears in many rows, indicating that the arm strengths differ significantly between most pairs of positions.
Key Insights
- Significant differences: Almost all pairwise comparisons show statistically significant differences. For example:
- Outfielders (CF, RF, LF) generally have higher arm strength compared to infielders (1B, 2B, 3B, SS).
- Third basemen (arm_3b) also tend to have higher arm strength than first basemen (arm_1b), as shown by an 8.43 mph difference.
- Largest differences: The biggest differences are between infield positions like first base and outfield positions like right field (arm_rf), where the arm strength difference can be over 13 mph.
Even though my hip is killing me, I feel very good about the results of this study.
Wrapping Up
So, what did I learn from all this? First, outfielders—especially those in right and center field—are in a league of their own regarding arm strength. Conversely, infielders don’t need the same power, but positions like third base and shortstop still require strong arms for those quick, long throws.
Running the ANOVA and Tukey’s test confirmed that these differences in arm strength are not random results due to the vagaries of sampling. Understanding these variations can be crucial for teams looking to optimize their defensive lineups or scout new talent.
Examining the data and seeing how arm strength varies across MLB positions was fascinating. I hope you enjoyed it. I am going to grab a beer and contemplate the disappointment of my team, the Cleveland Guardians, disastrously ending another year. Meh, what else is new?
![]()