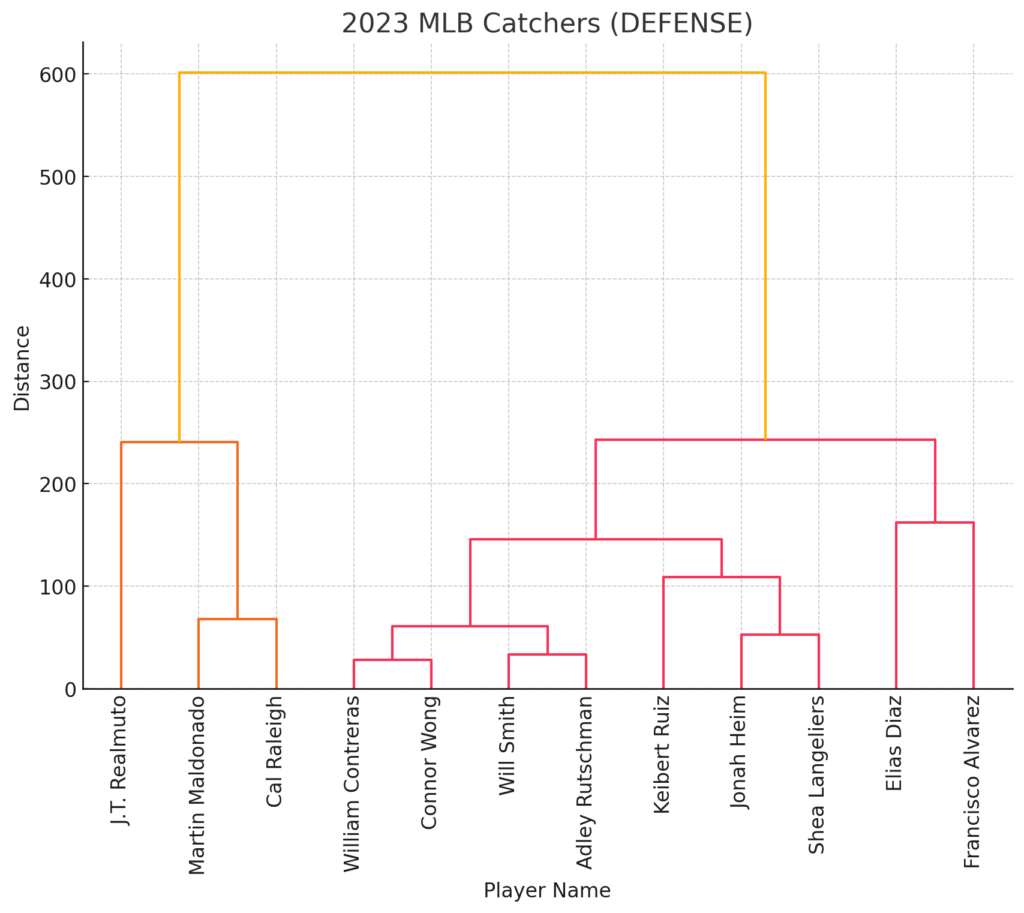
The hierarchical cluster tree, or dendrogram, visualizes the relationships among 2023 MLB catchers based on their defensive statistics. As always, players who are closer together on the x-axis have similar defensive profiles, meaning their statistics in categories like putouts, assists, errors, and caught stealing percentage are more alike. The height of the horizontal lines (distance) indicates how similar or dissimilar players are: the lower the line, the more similar the players are in their defensive performance.
The visualization highlights individual performance and helps teams or analysts compare players across a wide range of defensive metrics. For example, catchers clustered together likely share similar defensive styles or capabilities, making it easier to compare catchers in terms of their effectiveness behind the plate. Furthermore, the dendrogram’s structure shows which players stand out as outliers due to superior or weaker performance compared to their peers, giving teams valuable insights for recruitment, strategy, or training decisions.
Note that J.T. Realmuto is off by himself. Despite not receiving a Gold Glove Award, his defensive performance in 2023 was ostensibly exceptional. In a future post, I will drill down into the advanced metrics to see why he was overlooked. Don’t be surprised if the dendrogram I created in this post is deemed suspect in a few days or so.
![]()