The title of this post is unusual (you see what I did). Why? Historically, I have chosen titles inspired by the band Arctic Monkeys. They had a propensity for overly long song titles that may or may not have anything to do with the actual song. For the longest time, they were my favorite band. The last two CDs, though, have given me pause. I listened to both of them hundreds of times, and I must admit that I just don’t get it. Maybe on some deep (nearly subconscious) level, I have given this post a most unlikely title as a mild form of protest. I am dubious of my potential impact.
This short essay is about the offensive production of American League second basemen in 2009. I will view each player’s statistics through an Explanatory Data Analysis lens, specifically by creating different Scales of Unusualness.
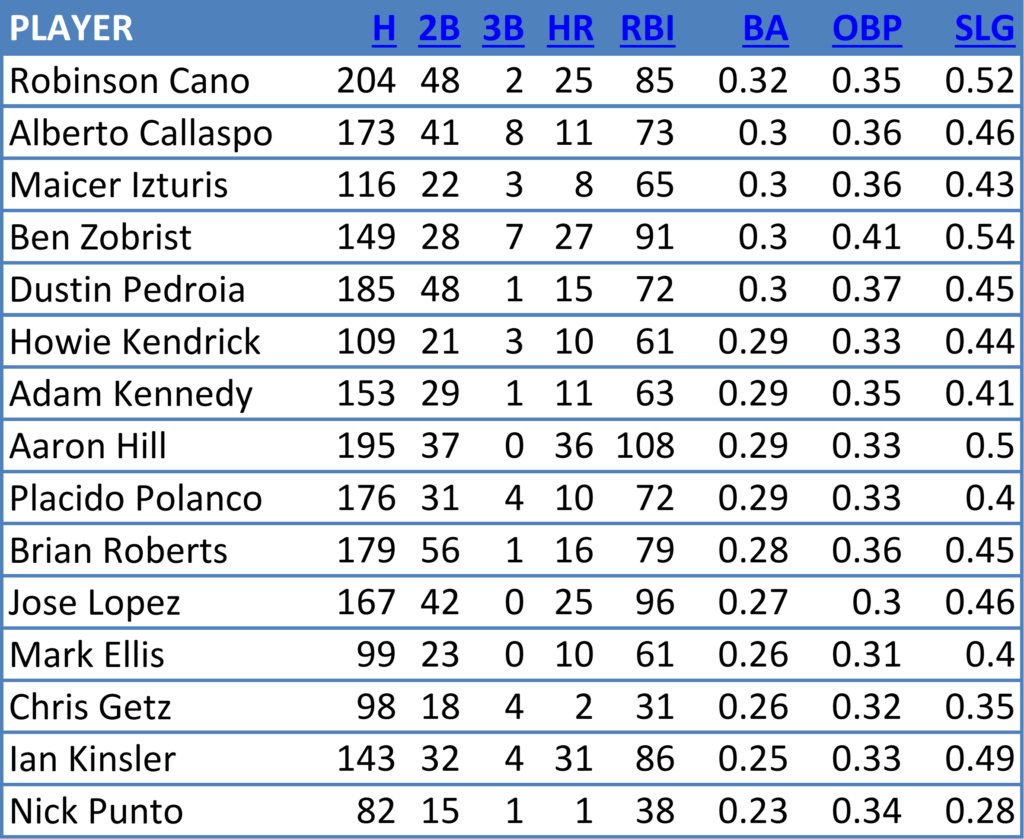
Here is a table of some of the data used for the study. Of course, the variables would be very different if we used players from last year. In 2009, no exit velocity or launch angle data were available. Even with this partial data set, many advanced metrics were eliminated from the table to make it more legible. Variations of these variables (and the others) were used to create the plot, which will appear shortly.

Table 1. AL Second Basemen, 2009
If we were just considering batting average (BA), it would be easy to rank the players. In fact, the players happen to be ranked in descending order based on that column, with Cano leading the way at .320. What happens if we want to consider all the variables together? Human brains aren’t very good at that task, but computers have no problem.
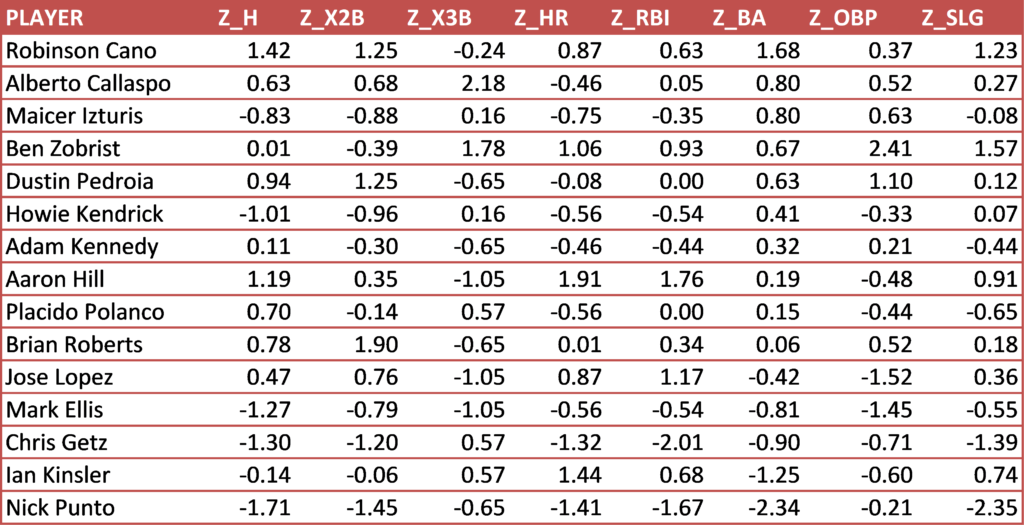
Next comes the scale that was referenced earlier. We can take each column and standardize the data by giving each value a z-score. A z-score measures the distance of a number in standard deviations from the mean of the data sample, in this case, all the columns with a “Z” prefix. Cano had the highest batting average, and you can see that his z-score for “Z_BA” is 1.68, which is more than double the next highest number in the column. That means his batting average for that year was highly unusual compared to other AL second basemen.
 Table 2. AL Second Basemen Z-Scores, 2009
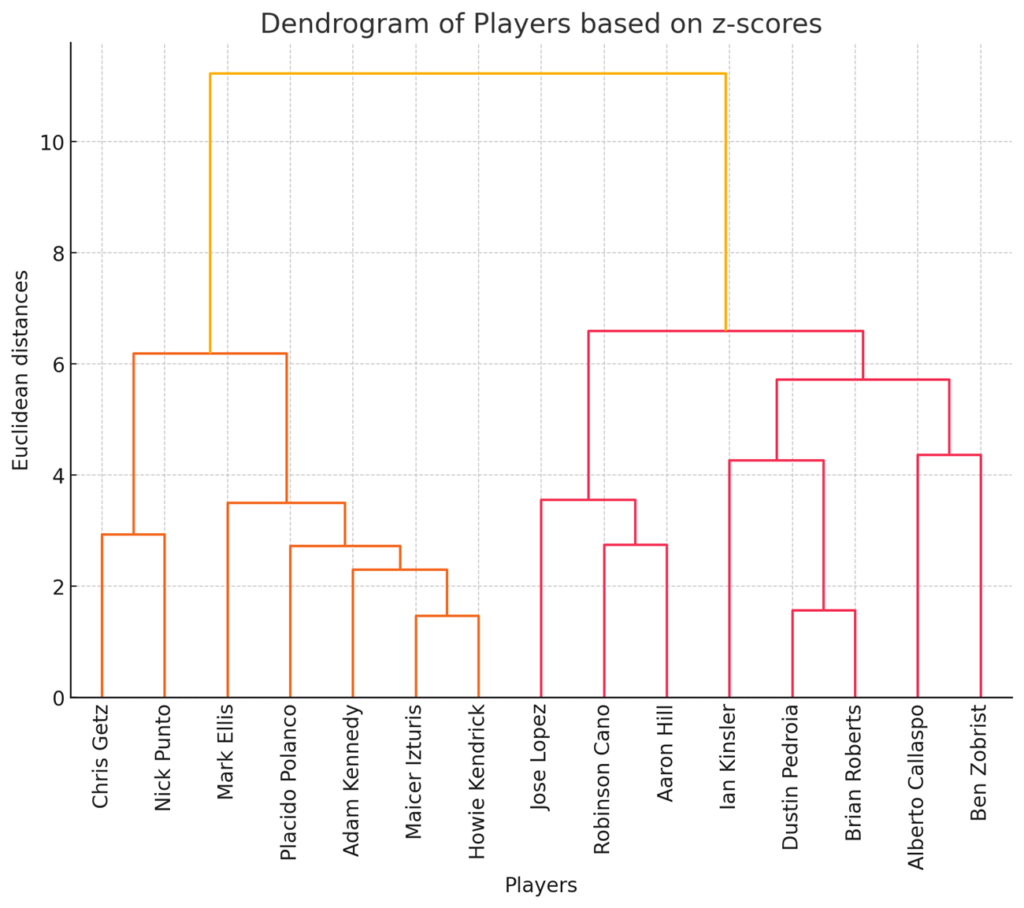
One interesting note. Look at the table and see if you can determine the two most unusual players when all the data is considered. I don’t think it can be done. There are eight variables, and that is six or seven too many. Fortunately, a technique called Cluster Analysis quickly solves the problem. Below is a Cluster Tree, or Dendrogram, of the computer’s analysis.

Figure 1. Dendrogram
The plot shows two large categories, those with high and those with relatively low offensive productivity. Among the top performers, the software identified Ben Zobrist as the most unusual. That means that Zobrist had the best offensive season of any AL second baseman that year. If you study the plot, you will see that Alberto Callaspo finishes a close second.
I would like to point out a couple more things. The plot shows that Maicer Izturis and Howie Kendrick had the most similar seasons. Their statistics were highly correlated in their unusualness with respect to the other players. Who knew?
So, as you might have guessed, there is a payoff to this post. A Scale of Unusualness doesn’t just identify the best or most productive offensive player; it works equally well on both ends of the scale. The most unusual offensive second baseman in the AL in 2009 wasn’t Zobrist; it was the unfortunate Nick Punto (with Chris Getz closing fast). Punto was much more unusually bad than Zobrist was unusually good. My guess is that when I include defensive metrics, Punto will more than redeem himself. You can’t play from 2001 – 2014 (and win a World Series) without being a big-time player. This one-year snapshot does not do him justice. Maybe I will post the defensive analysis next. Perhaps I will include offense and defense together in a more comprehensive study. Now that I think of it, I should take a break and give those Arctic Monkeys’ CDs another 300 listens.
