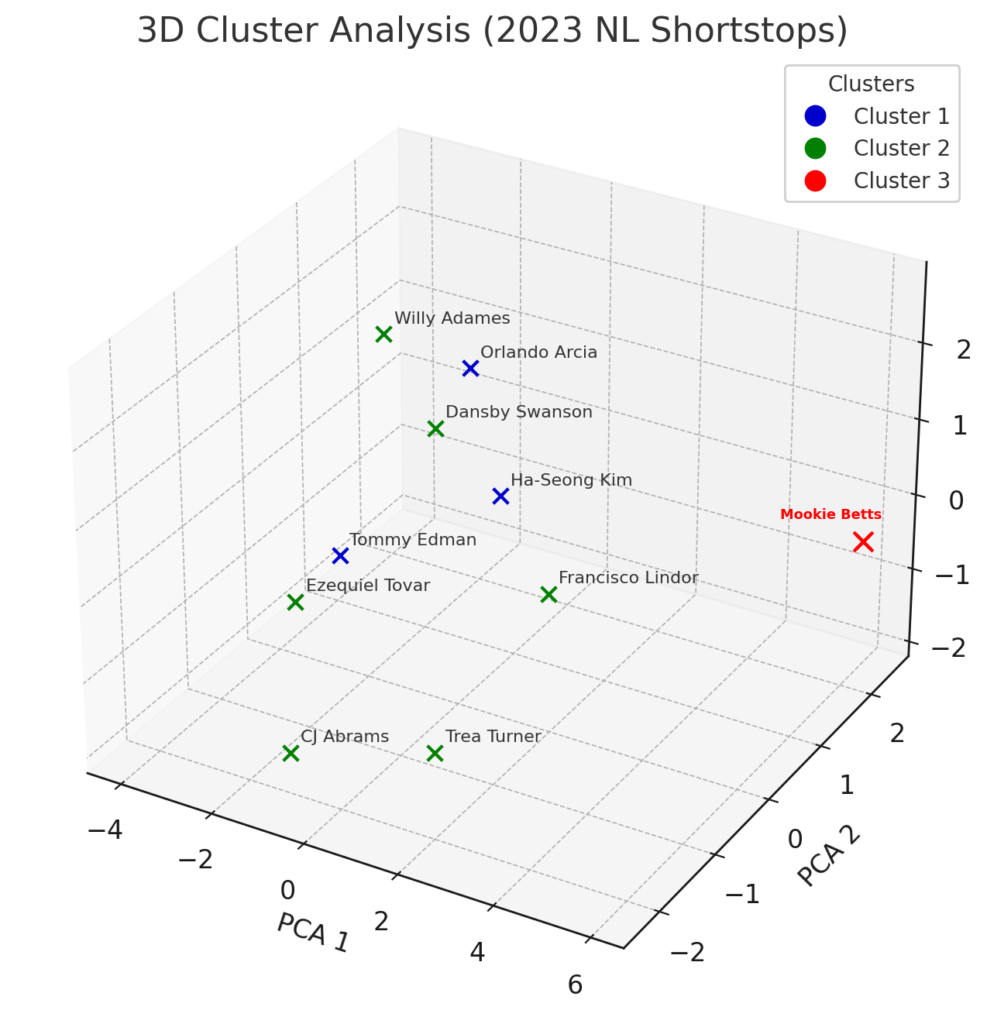
How is this for a different perspective? The 3D Cluster Analysis of 2023 National League (NL) shortstops visually represents player performance using an extra dimension, highlighting their key differences and similarities. Using a sophisticated technique called Principal Component Analysis (PCA), the high-dimensional performance metrics of the shortstops were reduced to three principal components, which encapsulate most of the variance in the data. This dimensionality reduction (or expansion, if you prefer) allows for a clear visualization in three-dimensional space, where each player’s metrics reflect their overall performance. The players are grouped into three distinct clusters, each represented by a different color, providing insights into how these athletes compare to one another based on their statistics.
The clusters were determined using the K-means clustering algorithm (much more of that down the line), which groups players with similar performance metrics into the same cluster. As earlier, the plot reveals three main clusters: Cluster 1 in blue, Cluster 2 in green, and Cluster 3 in red. Each cluster represents a subset of players with comparable performance profiles. For instance, the player in Cluster 3 (Mookie Betts), shown in red, exhibits stronger or more consistent performance in certain areas, distinguishing him from those in the other clusters.
Unsurprisingly, Betts is once again highlighted in the analysis. Notice that he is off by himself in red, focusing our attention. This emphasis allows for a closer examination of where Betts stands relative to his peers in the 2003 NL shortstop group. While I do believe that the two-dimensional plot from the last post is more diagnostic, no one can deny how cool the 3D plot looks. And that is why I published this post.
![]()