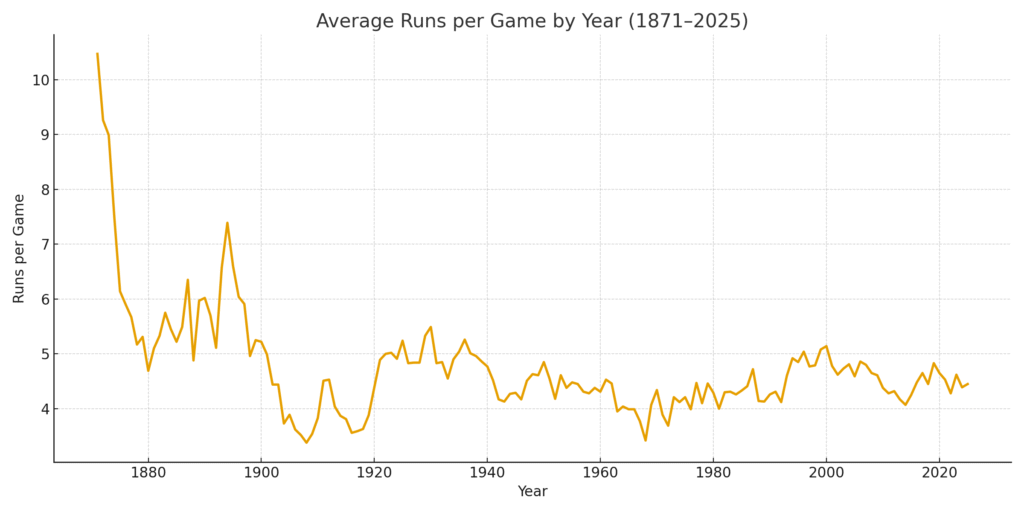
The folks with a serious interest in baseball have been meticulously recording the numbers the game generates since the 19th century, giving us one of the longest continuous statistical datasets in professional sports. Using MLB league totals from 1871 through 2025, I have traced the story of offense through a single, elegant metric: runs per game per team (R/G).
The chart below (based on raw data graciously provided by baseball-reference.com) visualizes the average runs scored per game per team by decade, beginning in the 1920s—an era often considered the dawn of modern baseball. I view 1920 as the beginning of the modern era, mainly due to the standardization of the balls used in the games. Before this date, the balls were haphazardly procured; there were no standards imposed, and none were implied. One game might finish with a score of 43 – 36, and the next might be 2 -1. This was a result of the baseball ( and yes, I mean singular ball) used in the game.
The figure tells an interesting story:
-
1930s: Offensive explosion. The live-ball era fully matured, and league scoring topped 5 runs per game.
-
1960s: The “Pitcher’s Decade.” Offense collapsed, bottoming out at 3.7 R/G in 1968—the “Year of the Pitcher.”
-
1990s: The power surge. League scoring rebounded to nearly 5 runs per game, driven by expansion, smaller parks, and the home-run boom. Surely, there are no other explanations, right? Cough, cough, hack, hack…
-
2020s: The analytics paradox (but not really). Despite smarter lineups and stronger hitters, offense has fallen again, down to 4.4 R/G in recent seasons. More on this later…
BATTING AVERAGES
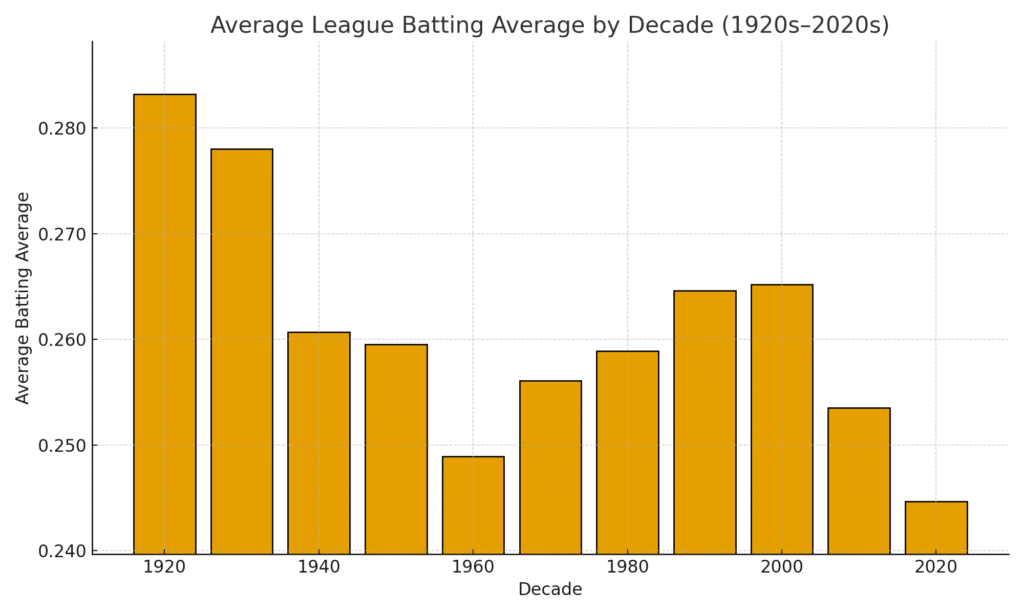
While run scoring has fluctuated wildly, the league batting average has remained remarkably stable. From 1920 onward, the overall mean is .262, almost identical to the all-time mark of .260 since 1871.
The highest batting averages came during the explosive decades of the 1920s and 1930s, while today’s hitters hover around .245, the lowest sustained level since the Dead Ball Era (1900-1920).
ANALYTICS
The offensive (and defensive) landscape of MLB can’t be understood without the analytics revolution, which ushered in a seismic shift in how teams interpret performance. It is, without doubt, the most transformative movement in the history of the game.
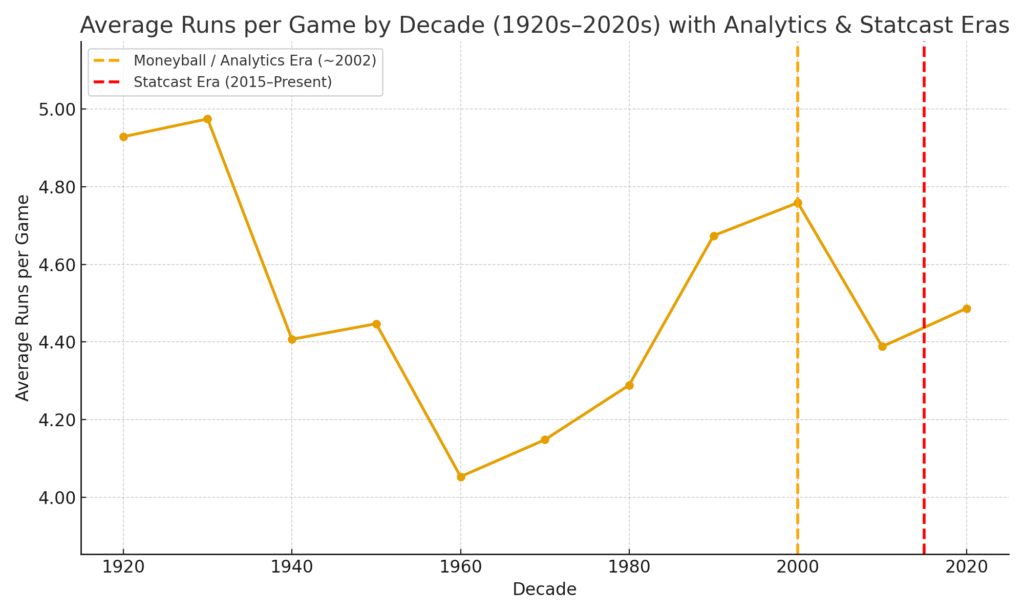
Baseball’s analytics revolution unfolded in three waves. The first began in the late 1970s, when writer Bill James published his Baseball Abstracts and coined the term “sabermetrics,” introducing a generation of fans and front offices to the idea that baseball could be studied scientifically. The second wave arrived around 2000, when the Oakland Athletics—immortalized in Moneyball—used data-driven roster construction to compete on a small budget. Their success sparked a league-wide shift toward on-base percentage, run efficiency, and market inefficiency analysis. The third and most mind-bending stage came in 2015 with the introduction of Statcast, a tracking technology that measures exit velocity, launch angle, spin rate, and player movement in real time. Together, these eras changed baseball from a sport of intuition to one of precision, where every swing, pitch, and sprint is quantified and optimized.
-
🟠 2000 – Moneyball / Analytics Era: Teams begin valuing on-base skills and cost efficiency.
-
🔴 2015 – Statcast Era: Tracking technology transforms player evaluation and biomechanics.
Interestingly, runs per game spiked during the early pre-Moneyball years (late 1990s) but declined sharply once every team adopted similar analytical models. The advantage disappeared as the playing field leveled and pitchers harnessed data to exploit hitters’ weaknesses. League-wide defense also vastly improved; the players had a much better idea of where to position themselves batter by batter and pitch by pitch.
THE APPARENT DATA PARADOX
Baseball-flavored analytics were initially designed to optimize offense, yet their full integration has arguably optimized defense and pitching instead. By 2025, batting averages and runs per game are both at their lowest sustained levels in decades—even as individual player performance is measured with unprecedented precision.
The result is a kind of equilibrium: fewer balls in play, more strikeouts and home runs, and an ongoing debate about whether efficiency has made the game better or simply duller.
Take a moment to look over the following table. I am struck by the downward trend in batting average. It sure seems like the table is calling out for a similar study using on-base and slugging percentages. I will address this issue in a future post.
| Metric | 1920–2000 | 2010s | 2020s |
|---|---|---|---|
| Avg. Batting Avg. (BA) | .264 | .254 | .245 |
| Avg. Runs per Game (R/G) | ~4.5 | 4.38 | 4.45 |
The 2010s and 2020s mark the first back-to-back decades of declining batting average since the 1960s. Despite this, run scoring remains relatively stable. Interesting, isn’t it? Even though there is only one batter and nine defenders, the offense-minded have concluded that home runs, even with the resultant declines in batting average and on-base percentage, are much more desirable than any other alternatives. This is a big reason why batting averages have gone down, defense and pitching have improved, and average runs per game have stayed consistent.
CONCLUSION
The numbers reveal something profound: baseball’s statistical evolution mirrors its cultural one, suggesting a fundamental constancy in its design. Each new wave of data, whether Bill James’ notebooks or Statcast’s terabytes of data, has changed how players are valued and how teams win. Yet through all of it, the sport’s core equilibrium remains intact. The league batting average, while steadily going down, still results in scoring of about 4½ runs per game—just as it did a hundred years ago. In the end, baseball adapts, but it rarely strays too far from its mathematical mean. I find that very intriguing.
The next post builds on the themes touched on in this short essay. I want to know where all the .300 hitters have gone, and I have decided to write about it. The next post will build on the work of Stephen Jay Gould, one of the most influential and essential evolutionary biologists of the last century. Perhaps most importantly, he was a big baseball fan who used his considerable talents to write about the sport he loved.
![]()