Wins and losses tell us what has happened. Composite metrics can help explain why.
Using offensive, pitching, and defensive data through May 12, 2026, I combined multiple American League team metrics into a standardized z-score framework. Each category was normalized relative to league averages, allowing offensive production, run prevention, and fielding quality to be evaluated on the same scale.
Rather than relying on a single statistic, this approach attempts to measure organizational balance. Teams receive positive scores when they perform above league average and negative scores when they fall below it. For pitching categories such as ERA and WHIP, lower values were inverted so that stronger performance always resulted in higher z-scores.
The result is less a standings table and more a multidimensional map of each team’s underlying quality.
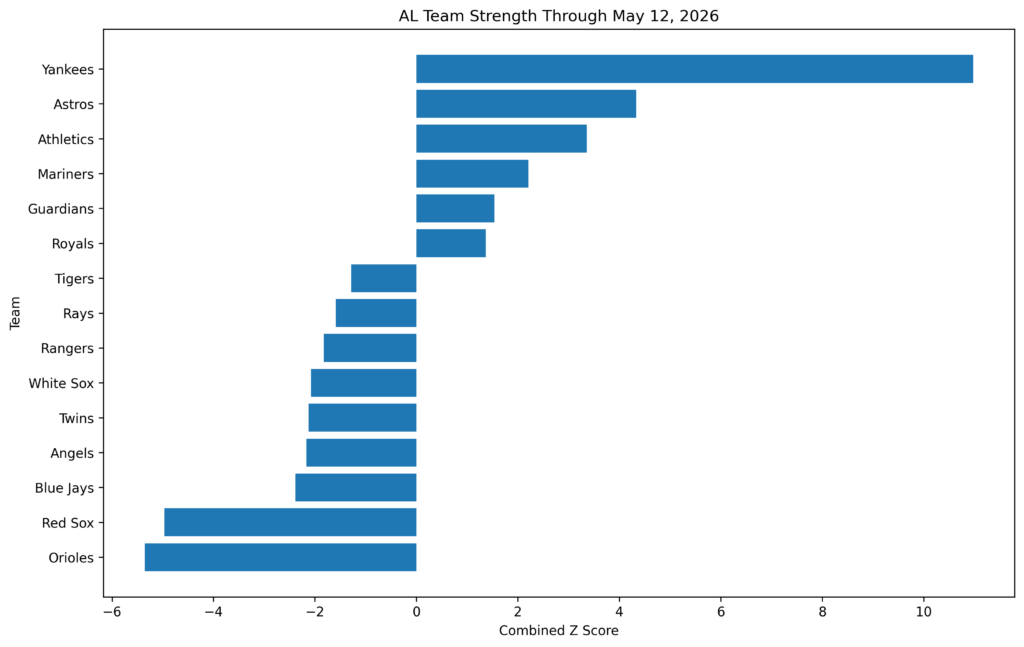
Figure 1: Composite AL Team Strength Through May 12, 2026
Yeah, the Yankees stand alone. They are out there by a large margin.
New York’s profile is unusually complete. They combine the league’s strongest offensive output with elite pitching performance, producing separation that becomes obvious once the categories are standardized. The offensive metrics are overwhelming enough on their own, but pairing them with the AL’s best ERA and WHIP creates a profile that resembles something other than just a hot start.
Perhaps most importantly, the Yankees are not merely winning through one dominant dimension. Many early-season contenders are sustained by either explosive offense or temporary pitching overperformance. New York grades strongly in both simultaneously. That is a big deal.
The Astros occupy a fascinating second tier. Houston’s offense remains extremely dangerous, leading the league in batting average while ranking near the top in slugging and run production. Yet the pitching profile is significantly weaker than expected, especially relative to prior Astros teams. Their overall placement illustrates how overwhelming offensive production can partially compensate for poor run prevention, at least over a 40-game sample.
The Athletics may be the most surprising analytical team in the league so far. Their composite score benefits from a quietly balanced structure. They field exceptionally well, avoid major pitching collapse, and generate enough offense to remain consistently above average across categories. This is not a team built around dominance. It is a team built around the absence of glaring weakness.
Cleveland fits a similar pattern. The Guardians do not dominate the league in any single category, but they remain consistently competitive across all three phases of the game. Their strong fielding profile, solid strikeout numbers, and competent offense produce one of the most stable composite structures in the American League.
Seattle grades better analytically than its current record suggests. The Mariners continue to pair strong pitching with quality fielding, even though the offense remains uneven (at best). Their underlying structure implies a team that could improve substantially if the bats normalize.
Meanwhile, Tampa Bay presents one of the more interesting contradictions in the league. The Rays possess one of the best records in the AL, yet their composite z-score profile remains only modestly above average. This may indicate sequencing luck, strong leverage performance, or simply an ability to maximize close games. Interestingly, this has long been a recurring characteristic of Tampa Bay baseball.
At the bottom of the rankings sit Baltimore and Boston. Neither team displays a single catastrophic weakness. Instead, the issue is cumulative mediocrity. Once standardized, multiple slightly below-average categories compound into significantly negative total scores. The Orioles, in particular, have struggled to prevent runs while failing to separate offensively from the league middle.
This raises an important analytical point. Baseball teams are often discussed in singular terms: “great offense,” “elite rotation,” “bad defense.” But actual team quality emerges from interaction effects across systems. Strong fielding can amplify pitching. High-strikeout staffs reduce defensive volatility. Power-heavy offenses can partially absorb bullpen instability.
The z-score approach attempts to capture some of that interconnected structure. As you know, it is a favorite strategy of mine.
No model perfectly predicts future outcomes, especially in May. Small samples remain volatile. Injuries reshape rosters quickly. Regression arrives unevenly. Yet early-season standardization can still reveal organizational identity. Some teams already appear structurally coherent. Others appear fragile despite respectable records.
And at the moment, one conclusion appears difficult to avoid: The Yankees are not simply leading the American League; they are performing as a dominant team would.
![]()