Money matters in baseball; it always has. In fact, it is the answer to any and every question you can conjure. The ability to absorb bad contracts, retain stars, and build depth across a 162-game season creates structural advantages that smaller-market clubs often cannot replicate. A sense of fairness is not built into the MLB’s financial model, yet the 2025 season once again demonstrated that payroll is not destiny.
Using Opening Day payroll data and final 2025 win totals, I examined the relationship between team spending and regular-season success. The result is less powerful than many fans would intuitively expect.
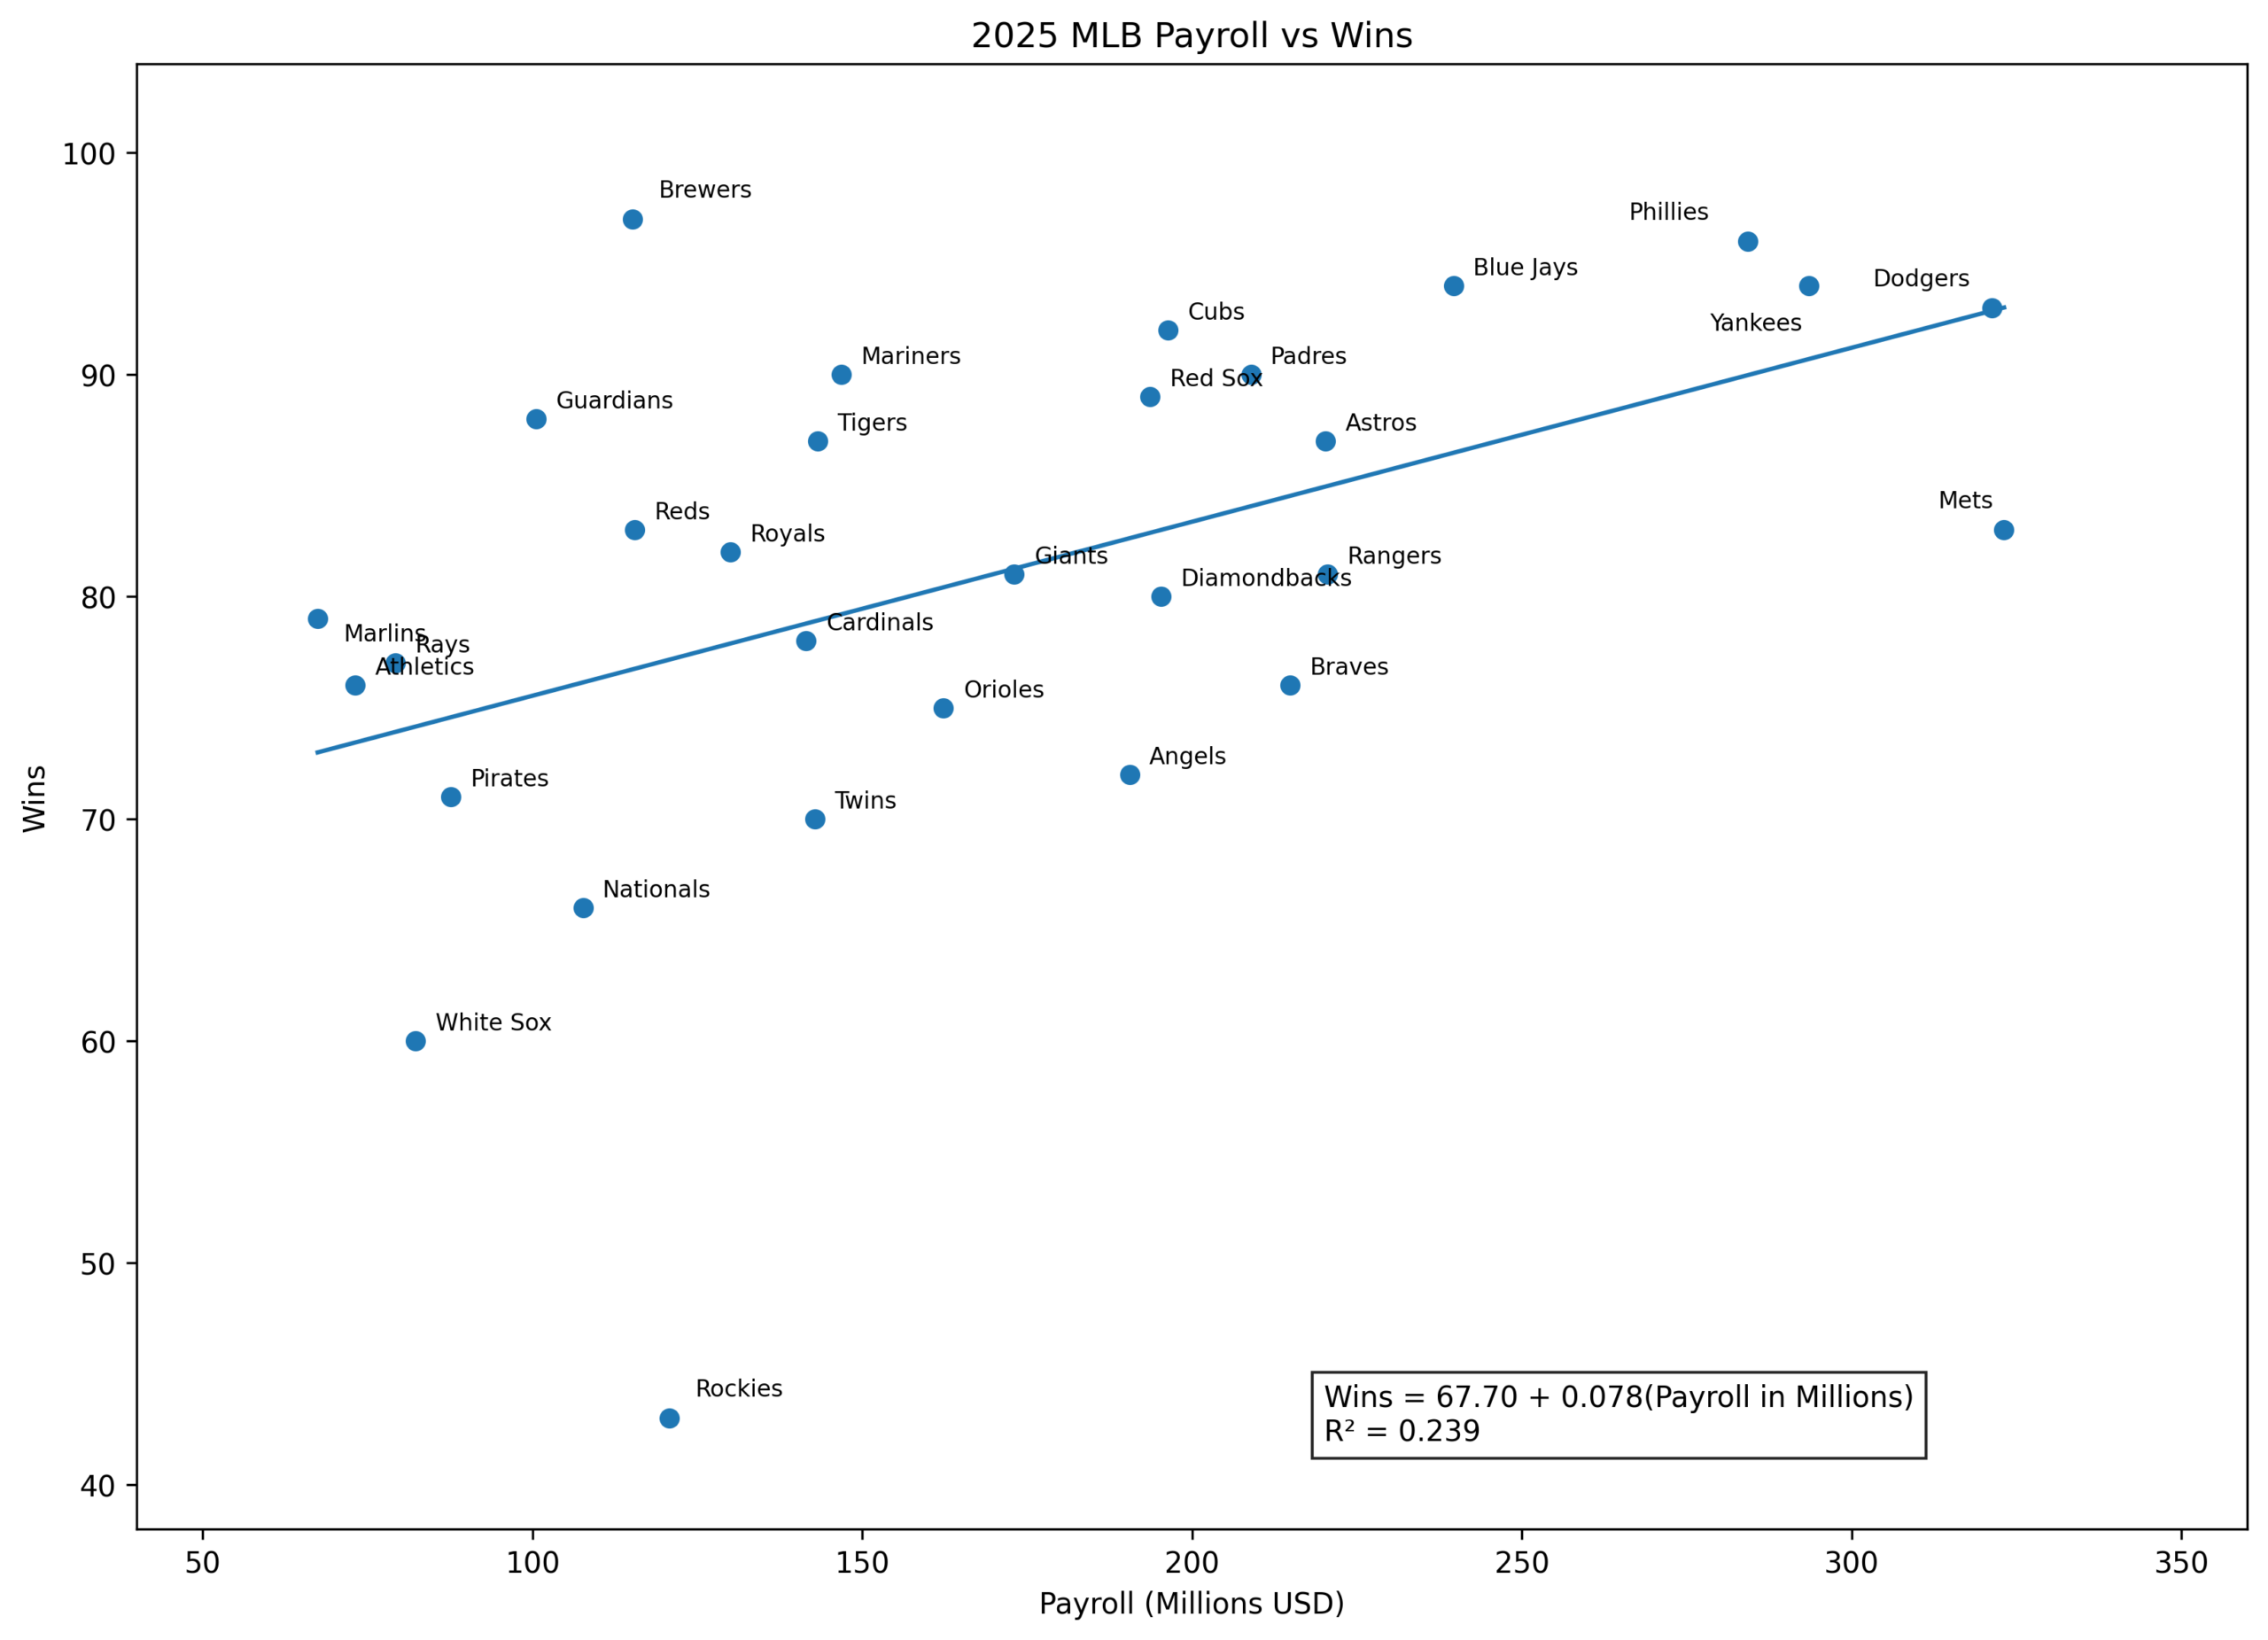
Figure 1 shows the relationship between payroll and wins across Major League Baseball in 2025. The regression equation is:
Wins = 67.72 + 0.078(Payroll in Millions) with an R² value of 0.239.
In practical terms, payroll explained only about 24% of the variation in team wins during the season. That means that roughly three-quarters of team performance emerged from factors outside direct payroll expenditure.
At the upper end of the spectrum, the expected pattern generally held. The Dodgers, Phillies, Yankees, and Blue Jays all combined elite payrolls with strong regular-season performance. Financial commitment clearly raises a team’s expected floor. Wealthier organizations can survive injuries, carry deeper benches, and absorb roster inefficiencies in ways that smaller-market teams often cannot.
But the more interesting story exists away from the regression line (maybe far away).
Milwaukee won 97 games despite operating with a payroll barely above $115 million. Cleveland won 88 games with a payroll just over $100 million. Seattle and Detroit also substantially outperformed expectations in terms of spending. These organizations extracted disproportionate value from player development, roster optimization, and organizational stability.
Conversely, several high-payroll clubs struggled to convert spending into victories. The Angels remained trapped in mediocrity despite nearly $191 million in payroll. Minnesota significantly underperformed expectations. Colorado combined middling payroll with catastrophic results, illustrating that payroll inefficiency can emerge at any spending level.
Perhaps most importantly, the relatively modest R² value suggests that baseball retains a degree of competitive entropy that distinguishes it from some other professional sports. Payroll creates leverage, but not certainty. Injuries, player aging curves, bullpen volatility, prospect development, managerial decisions, and even sequencing luck all remain deeply influential.
The relationship between money and wins, therefore, resembles probability rather than inevitability.
A large payroll buys optionality. It increases the margin for error. It raises the expected baseline. But it cannot fully eliminate randomness, inefficiency, or organizational dysfunction. Meanwhile, well-run smaller-market franchises continue to demonstrate that disciplined systems can partially offset financial asymmetry.
Baseball still resists complete economic determinism, even though the disparity in spending bothers me. That may be one of the reasons (among many) the sport remains analytically fascinating. It may also be why we do not have baseball next season…
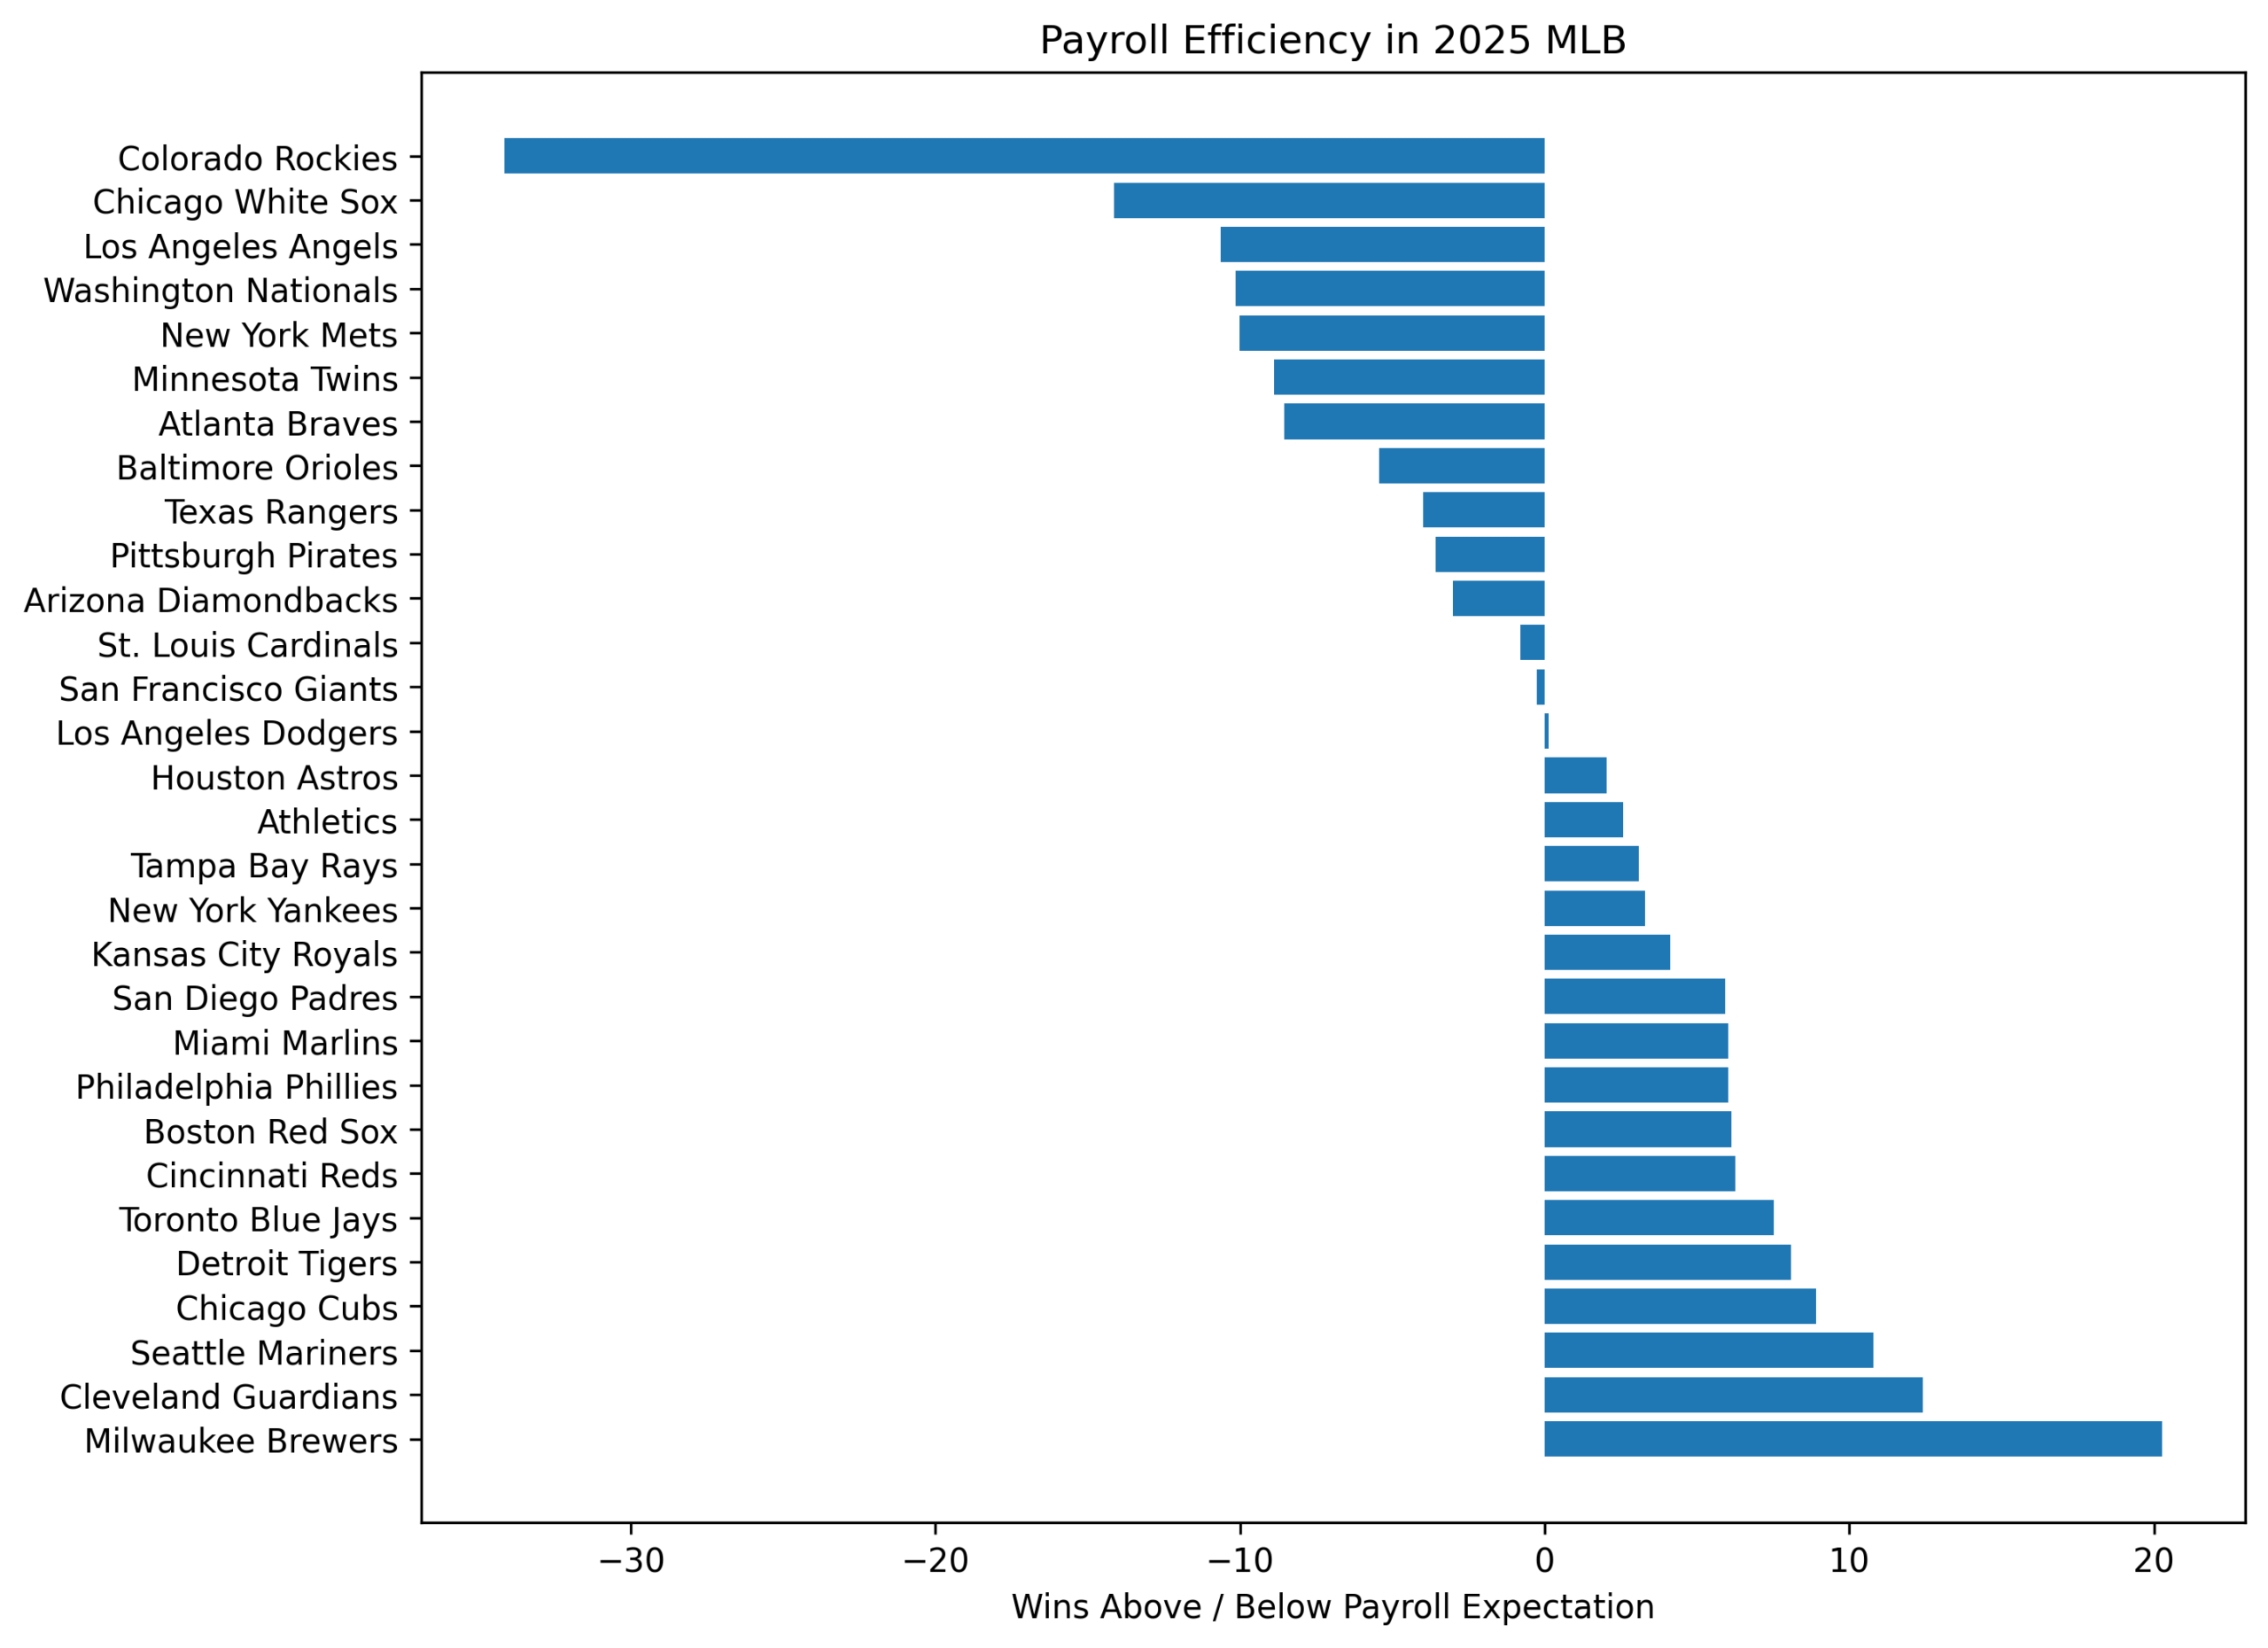
Figure 2 reframes the analysis by examining residual performance, or wins above and below payroll expectations. Milwaukee stands out dramatically, outperforming its payroll-derived expectation by more than 20 wins. Cleveland, Seattle, Detroit, and the Cubs also generated unusually strong returns on relatively minimal investment.
Interestingly, the scatter around the regression line itself may tell the larger story. If payroll truly governed outcomes in a deterministic fashion, the league would collapse toward a far tighter relationship. Instead, MLB continues to display substantial dispersion, suggesting that organizational intelligence (and the analytical insight it implies) still matters.
Perhaps that is baseball’s enduring equilibrium. Money shifts probabilities, but it does not fully control outcomes.
Postscript
Anything on your mind? Take a glance back at Figure 1. See the Rockies off all by themselves? That captured my interest. I decided to wait for a postscript to address it. I wonder who else noticed the anomalous Rockies in the plot…
The Rockies are noteworthy because they dramatically underperformed even with their relatively modest payroll expectation. In the regression framework, they occupy the extreme lower-left tail of MLB performance space.
They spent roughly $121 million and won only 43 games.
Based on the regression equation, a team with that payroll would have been expected to win the number of games predicted by the equation:
Wins = 67.72 + 0.078 (120.7)
That evaluates to approximately 77 wins. Instead, Colorado finished more than 30 wins below expectation, making them by far the largest negative residual in the dataset.
What makes this especially unusual is that they were not operating with a tiny payroll. Truly low-payroll teams like the Marlins or Athletics at least possess the structural explanation of minimal financial investment. Colorado spent at a middle-tier MLB level and still produced historically poor outcomes.
Several factors likely contributed. First, Coors Field distortions complicate roster construction. Pitchers often underperform there, and evaluating offensive statistics cleanly becomes difficult. Second, the Rockies have struggled for years with continuity in player development and with integrating modern analytics relative to the rest of MLB. Third, their roster construction often appears caught between rebuilding and competing, producing neither elite prospects nor stable veteran performance. Fourth, they lacked the depth necessary to absorb injuries or underperformance.
Analytically, the Rockies matter in this study because they exert substantial leverage on the regression itself. They are high-residual outliers, meaning they strongly influence the model’s slope and variance structure. If eliminated, we would get a different narrative. Anyone out there want to do that? Any young (or old) budding scientists interested in entering the arena? I am open for business.
In some ways, Colorado becomes the inverse mirror image of Milwaukee. Milwaukee demonstrated extreme organizational efficiency. Colorado demonstrated extreme organizational inefficiency, and that may or may not have been their fault.
That contrast may actually be the central lesson of this post. Organization, along with analytical luck and cleverness, means more than money.
![]()