Ryan-Tyler N. Mason
Here we are, a day later and (hopefully) a little wiser. I have more to say about yesterday’s post on those pesky first basemen. I can now tell you exactly how lucky or unlucky all of them have been so far this season.
BABIP, batting average on balls in play, is the metric used to determine the role of luck in a player’s offensive output. Here is the simple equation:
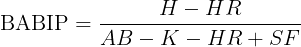
Where:
This equation shows what happens after contact is made and a ball is put in play. League-wide, and this has been true for a long time, players hover around .300. A BABIP of .300 is the de facto gravitational center for all players.
Take a look at this:
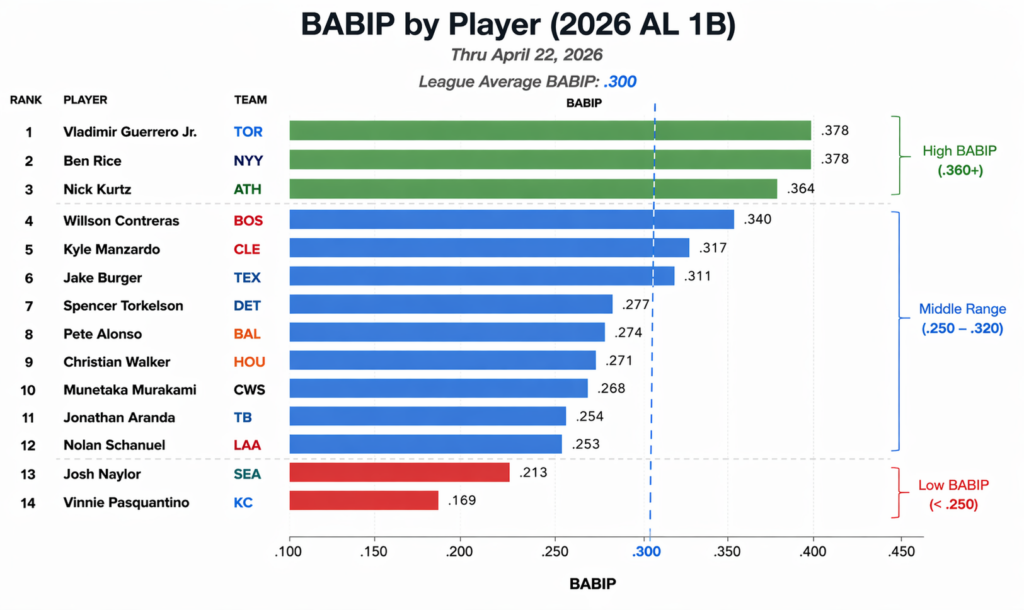
This is how we want to read the data. Guerrero (.378), Rice (.378), and Kurtz (.364) have been extremely lucky so far this season. I do not think they can maintain BABIPs that strong much longer. They will certainly regress to the league mean of ~.300.
On the other hand, Naylor (.213) and Pasquantino (.169) have been very unlucky. Those line drives are being hit right at fielders, and the hard-hit ground balls are not finding any holes. Both men should see their offensive production increase as their BABIPs work their way toward .300.
What about our man, Kyle Manzardo? At .317, he has not been unlucky at all. Not only has he not been unlucky, but he has likely benefited from slightly favorable outcomes on balls he has put in play. This means that balls are finding gaps at a slightly elevated rate, defensive positioning or variance is working in his favor, and there is no immediate signal of suppressed results due to bad luck. Once again, I was a bit surprised by this.
Manzardo’s BABIP implies that there should be downward pressure on his offensive production. Remember the graph from the last post? This does not bode well for a player whose output has been last in the league at his position. I am curious to see how this plays out.
![]()
I got up early today and decided to take a look at what has been happening in the American League with all the first basemen. I was inspired after I heard that Kyle Manzardo was having a very unlucky season at the plate. It happens, and there are very good metrics out there to measure things like luck.
I want to take a glance at what is going on about 25 games into the 2026 season. The first figure shows which players have the most similar production. Notice that Manzardo’s offensive output is most closely related to that of his old teammate, Josh Naylor. Both are off to very slow starts.
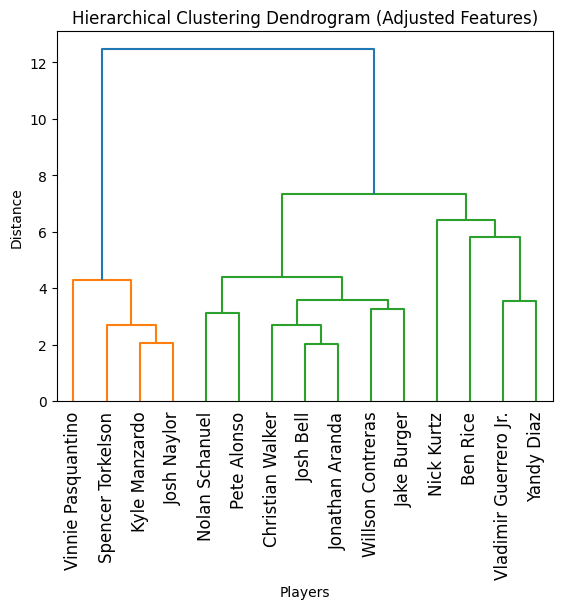
The players on the right-hand side of the figure should come as no surprise. What might give you pause is the next figure. Instead of clustering players based on similar offensive numbers, I decided to analyze them only by the categories that help their teams win. In other words, I eliminated things like strikeouts and double plays that the player might have grounded into.
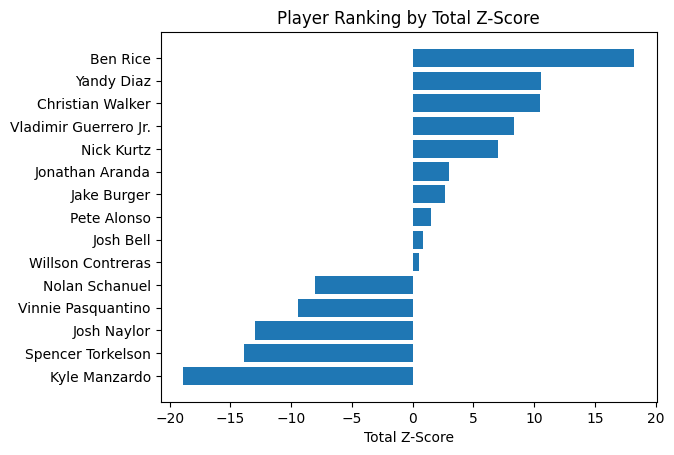
Our man Manzardo is all alone at the bottom of the list. I believe he is too good a player to remain there. The same is true for Naylor, and all the players with low rankings will probably increase their production as the weather warms.
If you study the chart, you will see that Ben Rice has been, by a wide margin, the most productive offensive first baseman in the American League so far this year. I was a bit surprised by this. I will keep an eye on things and report back throughout the season. Depending on the will of the Muses in control of The Boys of Summer, I might expand my horizons to every position in both leagues.
![]()
I woke up this morning and decided I was going to do something never before seen in the history of the universe. I started to solve the Riemann Hypothesis, but then thought better of it. Turns out, it is far easier to shuffle a deck of playing cards.

How many different possible combinations are there? More than a couple. Here is the answer in scientific notation:

Here is the number written out:
80,658,175,170,943,878,571,660,636,856,403,766,975,289,505,440,883,277,824,000,000,000,000
Let’s change that number to seconds. If you were to shuffle a standard deck of cards every second, starting at the Big Bang and continuing until today, you would not make a dent in the number. You would need this many years to exhaust all possible combinations:

The age of the universe in years:

So…yeah. Each time you properly shuffle a deck of playing cards, you are creating a sequence that most certainly has never been seen before and will never be seen again.
Notice that in this instance, uniqueness emerges from permutation. There is nothing special about the sequences, no narrative that can give them meaning. It is simply about the arrangement of playing cards. You might find that astonishing.
![]()
I was in the middle of writing another math post when I came across a “tok” on my phone (OK, a YouTube short). Mississippi State University has a young track and cross country runner named Louise Stonham who keeps randomly showing up on my feed. Today, I realized that we are kindred spirits.
Ok, so well over four decades ago, I was a D1 athlete. I have a letter and a mug somewhere in my house to prove it. For the last several weeks, it has been apparent to me that Ms. Stonham is very proud of her status as a D1 athlete, as she should be. It is a big deal. Not everyone can claim such an honor.
I always smile when she shows up on my phone, dancing and bouncing around like a promising young person with her entire life in front of her. What a joy she is. Today I saw something a little different.
Her latest post shows her running on the track. I am guessing it is a 10k race. The caption reads “When the hardest part of running isn’t the running itself… It’s battling the voice in your head.”
Truer words have never been spoken. I never have trouble getting out to run, the problem always comes when I am out there and the voice, that substantial and inevitable voice, tells me to slow down or cut the workout short. It happens all the time to me now, just as it has for decades.
I usually run 5 miles a day. Today, I gave in to the voice and stopped after 4 miles. “Stop…slow down…you have been running too hard…you are old…you don’t want to get hurt…you should have taken a day off…” You get it. This happens to me almost every day.
I just want to thank Ms. Stonham for letting me know I am not alone in my battle with myself. This is the first time I have ever heard another runner talk about this issue, a problem that has plagued me throughout my life.
Well, young lady, I am rooting for you. As I sit here in mythical Iriquois County, Ohio, I only wish you fulfillment and happiness. Do your best to never lose your joy for running or your passion for life. You are an inspiration. And, good grief, whatever happens, do not stop posting!
![]()
Herb Powell – Uncle Herb sounds so formal. Do you think you could call me Unky Herb?
Bart Simpson – No problemo, Unky Herb.
Most of my academic training has been in archaeology. There are two distinct camps among archaeologists. There are “artifact people,” those who study the past because of a fascination with material culture, and others (a distinct minority) find their way into the discipline for methodological and theoretical reasons. I am most certainly not an artifact person; I have never felt a thrill from holding a projectile point a thousand years old. To me, artifacts are data. The patterns they create are vastly more interesting than the material itself.
Archaeologists study artifacts to bolster theories of cultural and human evolution. Every dig, if properly executed, adds to our collective knowledge. A Marshalltown trowel placed in the dirt uncovers evidence that either supports or refutes specific scientific theories addressing changes in human behavior over time. That is why I studied archaeology; I was interested in how we get to “big idea” theories from material dug out of the ground.
For me, archaeology has always been a fundamentally mathematical and statistical discipline. If something couldn’t be quantified, it was of little interest to me. Knowledge and progress come from numbers, at least in my corner of the world. I spent decades studying the scientific method, specifically how statistical methods can be used for theory building. Archaeology was always a severe test case for me. Recreating entire cultures from stuff pulled from the dirt always struck me as a hard and interesting problem. Sometimes I think I know less now than when I started.
In 1985, I arrived in Cambridge, Massachusetts. For the first and only time in my life, I felt at home. I haven’t been back in nearly 35 years, but I still think about that place every day and dream about it every night. While there, I found my people. Those times were, without question, the best days of my life. There is no close second. A vignette about a day in my life on campus might be appropriate.
I remember one day when I was talking with my advisor, Bob, in his office in The Peabody Museum. This office was across the hall with a door with several names, including “Danson.” I recognized the other names, but Danson was unfamiliar to me. It seems that Harvard University kept the names of anyone who had occupied that office on the doors. My advisor’s office had the name “Kidder” listed on the door, for Alfred V. Kidder, an important and influential archaeologist who died in 1963. Bob and I often wondered if Kidder would approve of the conversations we had in his old office. We thought that he would.
So, what about this Danson character? Turns out it was the father of actor Ted Danson, widely known for his role as Sam Malone on Cheers. Ned Danson received his PhD in anthropology from Harvard in 1952. Who knew?
I mention the Danson story because, on the day I noticed the name on the door, Bob and I were discussing Ethnographic Analogy, a research method central to archaeology. Archaeologists use analogy to compare an unknown culture with other documented groups. Cultures in similar environments or with similar artifact assemblages are assumed to have much in common when reconstructing their political, religious, and social systems.
I remember that conversation because as I was explaining my objections to the methodology, Bob told me that an archaeologist needn’t use analogy when reconstructing past societies. I gave him a quizzical look as he said, “You can use metaphor!” I think my sigh was heard across campus. His point (and attempt at humor) was well taken: analogies (or metaphors) are integral to the thought process, despite the inherent problems and limitations of the procedures.
Shortly after our talk about ethnographic analogy, we crossed the street to get lunch. There, we had a chance encounter with a guy named Wally. He sat down and told us an unbelievable story about a mimeograph machine. If you ever run into me, ask me about it. I usually save it for special occasions (same with my Superman impression), but you never know, you might get lucky. I always say that the story includes two Nobel Laureates, a Harvard Professor, a beautiful, mysterious woman in a lab coat, and me. I will leave it to your imagination to figure out which person does not belong. That said, the necessary background is in place, and we can move to the material evidence.
32 CDs
Famous for burying the lede (it is my nature), I can finally get to Wayne’s wife’s uncle. I went to high school with Wayne. I met his wife once, and I don’t know any details about her uncle. The only thing I know is that he recently passed away. Wayne told me that he had a big library that they sold for pennies on the dollar. I really wish I could have gotten my hands on that library (more on that later). Wayne told me that he also had a large CD collection that they were going to throw away. I told him I would be happy to take it. I was already thinking about reconstructing this mysterious man’s life from the CDs. Think of this as my own version of a modern-day pseudo-archaeological study. I will treat each CD as I would an artifact from an archaeological site.
Wayne brought over two large cases, apparently full of CDs. They were strapped shut, so I didn’t have instance access. What I did have was 32 CDs in the CD player that Wayne also dropped off.
Of course, my first inclination was to do as much statistical analysis as possible on the CDs I had ready access to. I was severely limited in what I could do, largely because the sample I had was not random. It seems reasonable to assume they were selected with a specific purpose in mind. This is what I found.
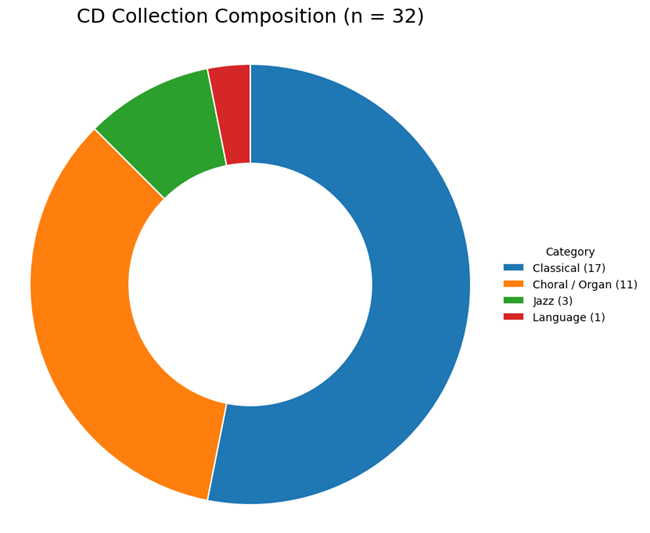
I have several observations made from these 32 data points. The first is that Unky Rick (I finally asked Wayne for his name) was either a fan of J.S. Bach or in a serious Bach phase when he passed away. I found 5 CDs in this sample dedicated to Bach’s music, including two performed on 8-string guitars. I must admit I did not know that 8-string guitars are a thing. Subsequently, I have found that they are popular in Scandinavian Heavy Metal Music, less popular in Jazz, and even rarer in Classical Music circles.
I am guessing that many of you do not realize that Bach is, by far, the most influential classical composer among modern rock musicians. Bach is the one they always talk about when it comes to their classical music influences. Was Unky Rick a rock musician? Doubtful. I do believe he had knowledge of and appreciated Bach’s well-known genius in what is known as contrapuntal composition.
As for me, I am a serious Wolfgang Mozart man. I believe that it is the greatest cosmic ripoff in the history of the universe that he was taken from us at such a young age. I have sat through numerous courses on Mozart, read all the books, and I listen to his music daily. Piano Concerto in D (K. 175) is playing in the background as I bang this post out right now.
Unfortunately, Unky Rick had only 1 (odds bodkins, just 1!) Mozart CD queued up on his player when I received it. I am in a forgiving mood, so I will let it slide and wait to see if there is more in the cases.
The next observation that gave me pause was discovering that Unky Rick had an affinity for modern classical composers. Many people, including me, who love classical music, do not bother with living composers. It simply is not done. Why would I listen to some random dude when I could bask in the genius of Mozart? For better or worse, the vast majority of people feel that way. Unky Rick was a clear exception.
I found one CD among the 32 that astonished me. This one data point instantly made me realize that had I met Unky Rick, we would have become instant friends. He and I, even though we never met and never will, were, are, and will remain kindred spirits. How is that possible from a single CD? I will make you wait for that answer because I just decided to open the cases. I am going to take an initial, random, non-scientific look at the contents.
1000 to 1100 CDs
OK… first of all, no Ludwig van Beethoven. I don’t see a single disc. Is that odd? Yes. I don’t listen to Beethoven because I do not think very highly of him. He ripped off Mozart, then stole from him some more, and then decided to “borrow” even more from my man. I really wonder why Unky Rick doesn’t have any. Did he feel the same way? I don’t think so. If he did, I would expect more Mozart in the collection than I found.
Perhaps even more curious is the following. No opera. Let me say that again, I could not find a single disc containing an opera in the entire collection. Like me, did he find the vocals distracting when he was studying or working? I must admit I am really surprised by this. Every classical music fan has to have some opera, right? Maybe? Is there a rule somewhere requiring it? I’ll look into it, but I am pretty sure that if you are sent the super secret opera decoder ring, you’ll need to provide proof of opera ownership. Did he have the ring? I do not know, but my guess is that his fingers were bare.
This next piece of information is very strange. I examined over 200 CDs, and I could not find a single one released after 1999. Why did he stop buying music for the last 25 or so years of his life? Did he start downloading new music? This is around the time Napster appeared in all its glory. That seems like the most logical explanation. I do not think that he lost interest in music and gave up. That doesn’t seem plausible at all.
Archaeologists have a specific term for this type of situation, terminus ante quem (TAQ). It is always good to throw a little Latin into a post, don’t you think? Since I found no CDs released after 1999, the collection has a TAQ of 1999. Nothing in that assemblage is later than that date. In archaeological terms, it is like a sealed layer that must predate a known event.
As the 32 discs imply, many present-day composers are represented in the cases, far more than the usual suspects. I did find a lot more Mozart and Bach, but the CDs are dominated by those who are alive today or are recently deceased.
So, was Unky Rick a professional musicologist or a music professor? I don’t think so. The CDs were not organized in any apparent fashion. They seemed haphazardly placed on the shelves. There were no categories indicated, nor were the performers or composers alphabetized in any form. A CD of didgeridoo music was next to a Gregorian Chants recording, which was beside a Dennison University Choir performance.
After this cursory glance, it is time to get to some real work.
Sampling
It is difficult for me to relate how much time I have spent studying sampling. I sat through course after course, book after book, and read article after article. I am still studying these procedures and am excited to learn more about Bayesian sampling techniques, a topic I know little about. Of course, I am familiar with Bayesian inference, but I have never had to take a sample within that paradigm.
One of the reasons I started this blog was to educate potential scientists. I want to give just enough information to pique the interest of someone who might one day want to take a much deeper dive into the topics I am interested in.
I bring this up because I decided to take an appropriate, scientifically valid sample of Unky Rick’s CD collection. I took an explicitly frequentist approach to this sample. Rest assured, I did not slop this together; I gave it careful thought. Hopefully, someone reading this post will be interested enough to take a more in-depth look at why I chose this exact equation.
Here is the sampling equation I utilized:

Where
N = population size (≈1050 CDs)
z = z-score for confidence level (1.96 for 95%)
p = estimated proportion (0.5 is used when unknown)
e = margin of error
The output from the equation means I can get a result at the 95% confidence interval with a +/- 6% error if I sample 200 CDs. Believe it or not, if he had an infinite number of CDs, all I would need is a sample of 384 to achieve a +/- 6% error range at this confidence interval. I have always found that fascinating. It is an unexpected outcome (maybe a quirk?) of statistical analysis. Since I received a little over 1000 CDs, I decided to pull out a random sample of 200 CDs. Here are the results.
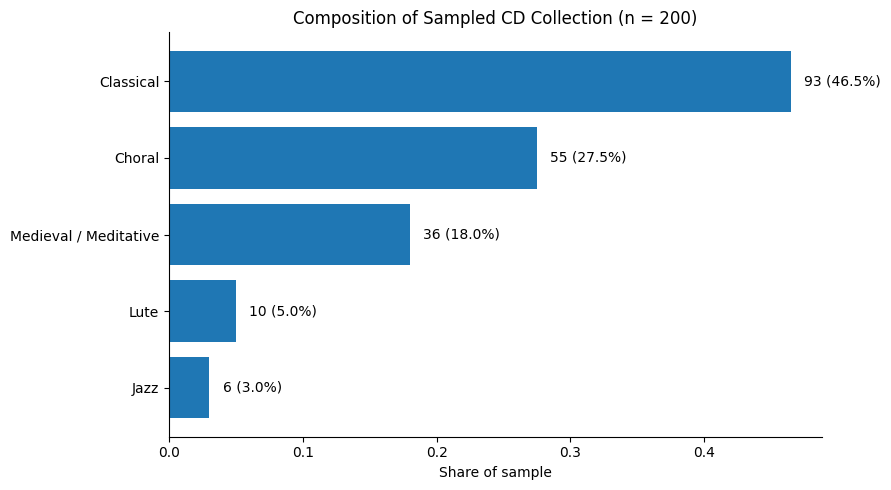
OK, the man had strong musical tastes. He knew what he liked, that much is certain. I immediately wanted to know how concentrated his CD collection is. The CD collection is focused on a few musical categories, with the majority of recordings falling into the classical and choral traditions. Earlier, I mentioned that I want to quantify all that is quantifiable. There is a metric that addresses the issue: the Herfindahl–Hirschman Index (HHI). I have never needed to use it, and I am glad it has come up now.
The Herfindahl–Hirschman Index (HHI) is a measure of concentration that describes how evenly or unevenly observations are distributed across categories. It is calculated by summing the squares of the proportions of each category:
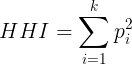
where pi is the proportion of observations in category i and k is the number of categories.
Because the proportions are squared, categories with larger shares contribute more heavily to the index. The HHI ranges from 0 to 1, with lower values indicating a more diverse distribution and higher values indicating greater concentration in a few categories.
Based on this sample and an HHI ≈ of 0.327, the CD collection is moderately to highly concentrated. It is reasonable to say “So what?” This type of index becomes more important when multiple cases are studied and compared. So, does anyone else have an interesting uncle?
I have to admit, this man is becoming increasingly fascinating as I delve deeper into what he left behind. He was unusual in the best kind of way.
Arvo Pärt and the Sound of Stillness
I still get a big kick out of learning new things. It sustains and elevates me. I remember one day, walking down a hallway on campus in Cambridge, I came across a remarkable door. What initially caught my eye was a large image of a very old, bearded man with a cane, struggling to carry several books under his arm. The caption read “Learning Until the Day I Die.” As I was looking over the image, the professor emerged from his office. I apologized for blocking his exit. He laughed and told me, “You know, that is why I post all the things on my door. I hope that someone might one day become inspired by something I taped up.” Well, I viewed that image 40 years or so ago, and I never forgot it. Well done, professor.
I am happy to report that I have learned a great deal while writing this post. I had to research Gregorian Chants, a staple of Unky Rick’s chosen material, and Arvo Pärt, the most performed living classical composer in the world. It will surprise no one that Gregorian Chant deeply influences Pärt’s canon.
I noticed CD after CD with Pärt’s name on the cover. Of course, I became curious about this man and set to my task. I have listened to hours of his music, and I am now thoroughly convinced that Unky Rick had a sophisticated musical knowledge far beyond mine. If this were an official “Archeological Dig,” I would call in experts to consult.
I can, though, relate what my research has uncovered. At a surface level, both traditions, Gregorian Chant and the Pärt School, share an obvious feature: slowness. Gregorian chant unfolds without rhythm in the modern sense. It moves like breath, displaying an ethereal quality. Pärt’s music, especially in his tintinnabuli style (a method he invented), is similarly restrained. The sparse notes appear with deliberate spacing, often surrounded by large fields of silence. For the casual listener, this can feel uneventful. For the informed and devoted listener, however, the silence is not emptiness; it is structure.
This distinction matters, especially to those who take this music seriously.
People who gravitate toward these musical forms often demonstrate a high tolerance for stillness. They are comfortable with and enthusiastically welcome environments that others might label ‘quiet’ or ‘uneventful’. Perhaps more importantly, they do not experience silence as an uncomfortable or awkward gap. Instead, silence becomes an integral element of the experience itself. In a sense, the listener participates in the music by providing patience.
From an analogical perspective, this suggests a reflective disposition. My research suggests that individuals attracted to Gregorian Chant and Pärt are often curious about deeper questions. Philosophy, theology, history, and even mathematics often appear somewhere in their intellectual orbit. The music itself invites this orientation. A medieval chant carries nearly a millennium of cultural continuity. A Pärt composition often hides a precise structural logic beneath its simple surface. Both traditions reward attention to pattern. Of course, a look at Unky Rick’s elusive library would answer those questions.
Interestingly, pattern recognition, the heart of mathematical thinking, is central here. Gregorian chant follows modal systems rather than modern harmonic progressions. The listener gradually learns the contours of these modes, much as one recognizes the grammar of a language. Pärt’s work is even more explicit in its architecture. The tintinnabuli technique pairs melodic lines with triadic tones in carefully constrained relationships. The resulting sound is spare, yet mathematically coherent.
I normally write the beginning of a post last. After learning more about the music in the cases, I revised the initial paragraphs because it is clear to me that, if Unky Rick had been an archaeologist, he would not have been an artifact guy. He experienced his music in a very sophisticated way, through the patterns present and implied. I think this also explains his interest in Jazz. Serious officianiados of that genre consider the notes not played as well as those performed.
For analytically inclined minds, this pattern recognition is the point.
Another shared characteristic of these listeners is a preference for depth over novelty. In contemporary culture, novelty functions as currency. Streaming platforms encourage constant movement between songs, artists, and genres. Chant and Pärt operate under a completely different logic. The value of the music often increases with repetition. A piece heard dozens, or hundreds, of times reveals details that initially pass unnoticed.
Perhaps most importantly, this listening pattern cultivates a particular emotional tone. The experience is not dramatic in the cinematic sense. Instead, it produces something closer to equilibrium. The music does not overwhelm the listener. This may be why there was no opera in the collection. He did not wish to be overwhelmed by the music; he wanted a more subtle, perhaps meditative, experience.
This is where the personality profile, derived through the analogy process we previously discussed, becomes especially interesting. The typical admirer of chant or Pärt often feels deeply, but expresses it with restraint. There is an appreciation for sincerity without theatricality. Beauty emerges through subtlety rather than intensity.
Importantly, this aesthetic preference frequently extends beyond music. Minimalist architecture, clean typography, uncluttered workspaces, and carefully organized data structures often appeal to the same individuals. The underlying principle remains consistent: remove the unnecessary elements, thereby allowing the structure to speak.
There is also a historical dimension. Gregorian chant connects the listener to an unbroken musical tradition reaching back through monasteries, manuscripts, and medieval cathedrals. Even for a secular listener, the sense of temporal continuity is striking. One hears not only a melody, but a fragment of cultural memory.
Pärt’s music operates similarly, though in a modern context. His work feels ancient, even though it was composed recently. The sound suggests continuity with something older than modernity itself.
Perhaps most importantly, this musical preference reveals an unusual relationship with time. Chant and Pärt slow perception. They create a space where minutes stretch, and attention deepens. In a culture built on acceleration, this becomes a quiet act of resistance.
The listener who loves this music is therefore not simply nostalgic or eccentric. He is practicing a different mode of attention.
At the core, that may be the real attraction. Silence, when properly structured, becomes a kind of equilibrium. And equilibrium, as it turns out, has its own music.
Oddly enough, and this is another extraordinary bit of synchronicity, I do have knowledge of specific aspects of the medieval world. I took around a half-dozen seminars on the history of medieval science back in the 1980s. I was tracing the shift from the demon-haunted world of that day to the more enlightened one of the Scientific Revolution. During all that time, the importance of music never came up. I can’t remember it ever being mentioned, and I never considered the musical tastes of the day to be relevant to anything I was studying.
Now I can conclude this section of the post. How? How else but with a discussion of French High Brow Cinema.
Zbigniew Preisner
I have a young friend (is a rapid approach toward 30 considered young?) named Sage who recently completed a master’s degree in English. I tagged along for the entire program. I read the assignments, watched the things they watched, and looked over her papers before she turned them in. Truth told, she didn’t need me to look over anything. She is a very smart and extraordinarily capable lady.
One of the last classes she took addressed the French Philosopher Jacques Derrida and his thoughts on what is known as Narrative Framing. Yeah, yeah… I know, not your run-of-the-mill topic. The professor had everyone watch three movies by the brilliant Polish director Krzysztof Kieślowski, a true person of genius. Known as Three Colours (Blue, White, and Red), the films are masterpieces of European (particularly French) Cinema. I believe I fall in love with Irene Jacob, the brilliant actress, again and again every time I rewatch Red, my favorite of the trilogy.
Sage’s professor repeatedly mentioned that the music throughout the trilogy was sublime and deserving of serious study. Her professor was correct. You have probably figured out that Preisner wrote the music for all three movies and that Unky Rick had a Preisner CD among the initial 32 that I found.
When I told Sage what I had discovered, she thought the same thing I did: “How cool!” The CD, Requiem For My Friend, is a tribute that Preisner wrote for Kieślowski upon his death in 1996. Unky Rick surely knew of the trilogy and appreciated the genius of these two men. That one CD, more than the entirety of the whole collection, convinced me that Unky Rick and I would have enjoyed talking about his love of music.
I would have been happy to share a meal with him as we discussed what he found special about Preisner’s music. I am convinced he would have had some illuminating insights, and it is unfortunate I will never hear them.
Conclusion
As I write this post, I find myself constantly returning to the tragic events of July 12, 1562. A Franciscan friar (whom I refuse to name), a dimwitted individual from Spain, burned nearly all of the written records of Mayan civilization. They were, in his estimation, works of the devil produced by ignorant heathens. For the sake of all that is good and holy, God himself told the friar that the materials needed to be destroyed. To this day, only four Maya codices survive.
While the destruction of the written records of the Mayan civilization is a tragedy, the disappearance of Unky Rick’s library is nothing more than a footnote in history. Yet, from an archaeological perspective, the situation is the same. The materials are gone, and nothing can be done about it. There was a lot to be learned, but circumstances got in the way.
Why am I fixated on Unky Rick’s library? I have written about my own substantial library. Decades ago, I had hoped it could be kept together and passed down to someone who would appreciate it. I now know that it is a pipe dream. No one will care, and the removal of the books from my home after I am gone will be more of a burden than an opportunity for discovery (good luck, Sage). That doesn’t make me sad; it only makes me shrug my shoulders.
As for Unky Rick’s library, did he have any books about the movie trilogy? Was his copy of Plato’s Republic worn out? I bet he had texts on Aristotle and knew that Socrates didn’t want anyone to write anything down. Did he have any materials about his favorite violinist (Esther Abrami, anyone?) or did he not bother with such trivialities? Would his library tell more about him than the CDs? That is a very good question, and I don’t have a good answer. I do know that my library would expose me.
I have some final, purely speculative, thoughts on Wayne’s wife’s uncle. I don’t think he ever married; there was nothing overtly kid-friendly in the cases. I believe he was highly educated and deeply religious. He certainly could have been a member of the clergy. He was a man who might have felt he was born out of time, believing that the 1300s or 1400s were better times to live in. He watched The Name of the Rose more than once (as I have) and had a highly cultivated mystical (make that spiritual) side (as I do not have).
I believe he lived near Columbus, Ohio, and probably attended Denison University or had a close relationship with it. I gathered this information from the CDs; many were purchased in Columbus, and several feature performances by Dennison orchestras and choirs.
He was a thoughtful, intelligent man in a progressively dense and reactionary world. I would have been delighted to have some tacos and beer with him as we discussed how Preisner’s music informed and framed Kieślowski’s narrative vision. I am convinced he would have had some interesting insights. Finally, I hope he had people in his life who appreciated him, and I really wish I had known him.
![]()
The folks with a serious interest in baseball have been meticulously recording the numbers the game generates since the 19th century, giving us one of the longest continuous statistical datasets in professional sports. Using MLB league totals from 1871 through 2025, I have traced the story of offense through a single, elegant metric: runs per game per team (R/G).
The chart below (based on raw data graciously provided by baseball-reference.com) visualizes the average runs scored per game per team by decade, beginning in the 1920s—an era often considered the dawn of modern baseball. I view 1920 as the beginning of the modern era, mainly due to the standardization of the balls used in the games. Before this date, the balls were haphazardly procured; there were no standards imposed, and none were implied. One game might finish with a score of 43 – 36, and the next might be 2 -1. This was a result of the baseball ( and yes, I mean singular ball) used in the game.
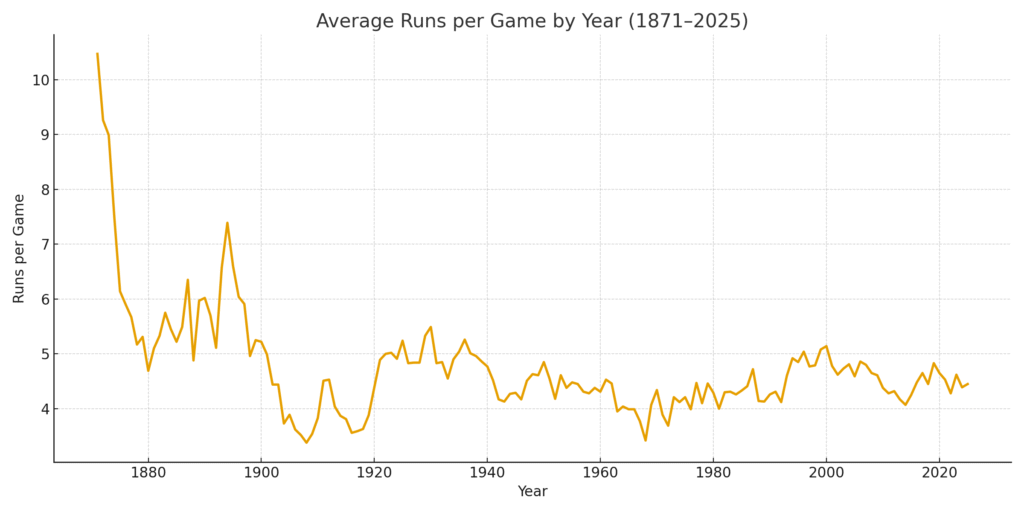
The figure tells an interesting story:
1930s: Offensive explosion. The live-ball era fully matured, and league scoring topped 5 runs per game.
1960s: The “Pitcher’s Decade.” Offense collapsed, bottoming out at 3.7 R/G in 1968—the “Year of the Pitcher.”
1990s: The power surge. League scoring rebounded to nearly 5 runs per game, driven by expansion, smaller parks, and the home-run boom. Surely, there are no other explanations, right? Cough, cough, hack, hack…
2020s: The analytics paradox (but not really). Despite smarter lineups and stronger hitters, offense has fallen again, down to 4.4 R/G in recent seasons. More on this later…
BATTING AVERAGES
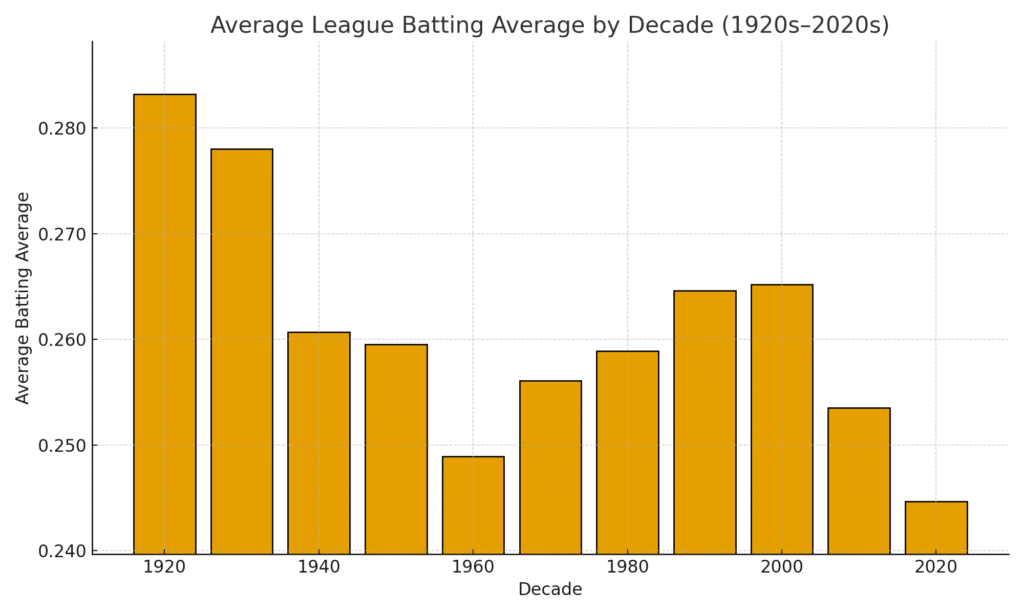
While run scoring has fluctuated wildly, the league batting average has remained remarkably stable. From 1920 onward, the overall mean is .262, almost identical to the all-time mark of .260 since 1871.
The highest batting averages came during the explosive decades of the 1920s and 1930s, while today’s hitters hover around .245, the lowest sustained level since the Dead Ball Era (1900-1920).
ANALYTICS
The offensive (and defensive) landscape of MLB can’t be understood without the analytics revolution, which ushered in a seismic shift in how teams interpret performance. It is, without doubt, the most transformative movement in the history of the game.
Baseball’s analytics revolution unfolded in three waves. The first began in the late 1970s, when writer Bill James published his Baseball Abstracts and coined the term “sabermetrics,” introducing a generation of fans and front offices to the idea that baseball could be studied scientifically. The second wave arrived around 2000, when the Oakland Athletics—immortalized in Moneyball—used data-driven roster construction to compete on a small budget. Their success sparked a league-wide shift toward on-base percentage, run efficiency, and market inefficiency analysis. The third and most mind-bending stage came in 2015 with the introduction of Statcast, a tracking technology that measures exit velocity, launch angle, spin rate, and player movement in real time. Together, these eras changed baseball from a sport of intuition to one of precision, where every swing, pitch, and sprint is quantified and optimized.
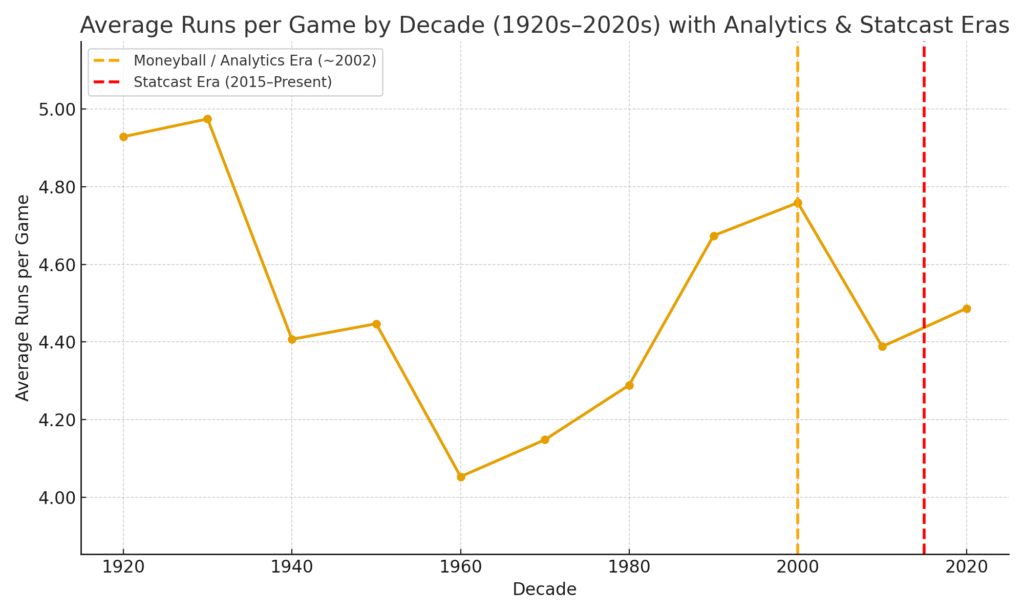
🟠 2000 – Moneyball / Analytics Era: Teams begin valuing on-base skills and cost efficiency.
🔴 2015 – Statcast Era: Tracking technology transforms player evaluation and biomechanics.
Interestingly, runs per game spiked during the early pre-Moneyball years (late 1990s) but declined sharply once every team adopted similar analytical models. The advantage disappeared as the playing field leveled and pitchers harnessed data to exploit hitters’ weaknesses. League-wide defense also vastly improved; the players had a much better idea of where to position themselves batter by batter and pitch by pitch.
THE APPARENT DATA PARADOX
Baseball-flavored analytics were initially designed to optimize offense, yet their full integration has arguably optimized defense and pitching instead. By 2025, batting averages and runs per game are both at their lowest sustained levels in decades—even as individual player performance is measured with unprecedented precision.
The result is a kind of equilibrium: fewer balls in play, more strikeouts and home runs, and an ongoing debate about whether efficiency has made the game better or simply duller.
| Metric | 1920–2000 | 2010s | 2020s |
|---|---|---|---|
| Avg. Batting Avg. (BA) | .264 | .254 | .245 |
| Avg. Runs per Game (R/G) | ~4.5 | 4.38 | 4.45 |
The 2010s and 2020s mark the first back-to-back decades of declining batting average since the 1960s. Despite this, run scoring remains relatively stable. Interesting, isn’t it? Even though there is only one batter and nine defenders, the offense-minded have concluded that home runs, even with the resultant declines in batting average and on-base percentage, are much more desirable than any other alternatives. This is a big reason why batting averages have gone down, defense and pitching have improved, and average runs per game have stayed consistent.
CONCLUSION
The numbers reveal something profound: baseball’s statistical evolution mirrors its cultural one, suggesting a fundamental constancy in its design. Each new wave of data, whether Bill James’ notebooks or Statcast’s terabytes of data, has changed how players are valued and how teams win. Yet through all of it, the sport’s core equilibrium remains intact. The league batting average, while steadily going down, still results in scoring of about 4½ runs per game—just as it did a hundred years ago. In the end, baseball adapts, but it rarely strays too far from its mathematical mean. I find that very intriguing.
The next post builds on the themes touched on in this short essay. I want to know where all the .300 hitters have gone, and I have decided to write about it. The next post will build on the work of Stephen Jay Gould, one of the most influential and essential evolutionary biologists of the last century. Perhaps most importantly, he was a big baseball fan who used his considerable talents to write about the sport he loved.
![]()
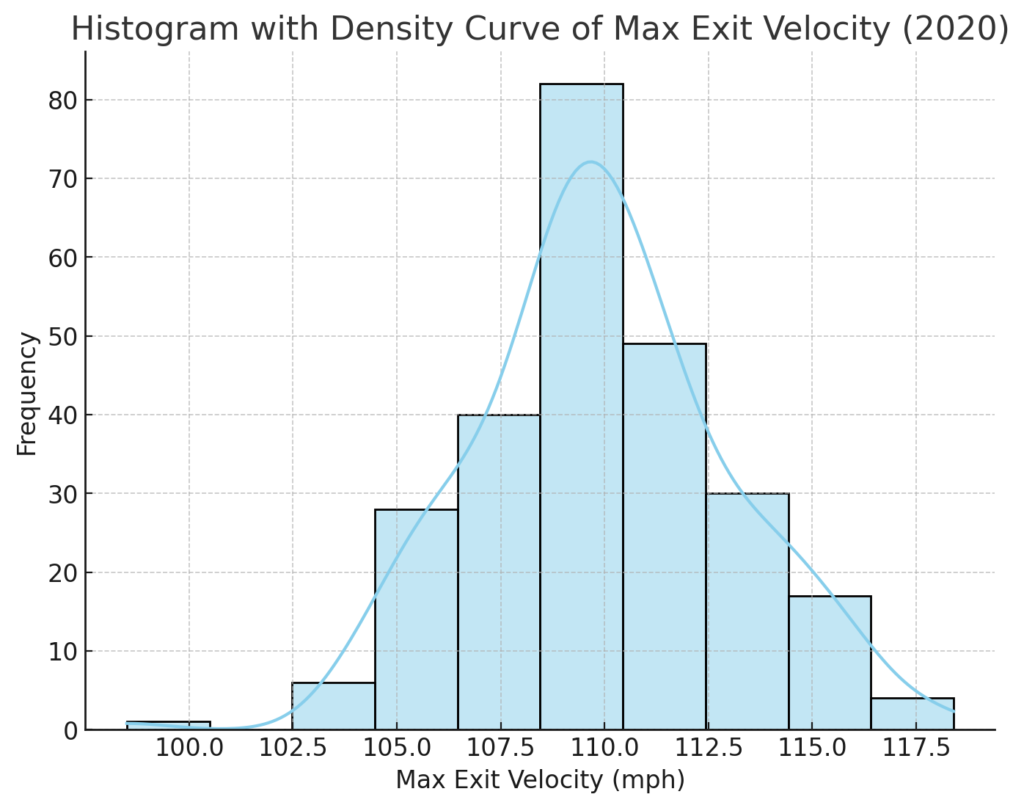
In baseball analytics, exit velocity—specifically, the maximum exit velocity—is a critical metric. It measures the speed at which a ball leaves the bat, providing insights into a player’s power and potential impact. I am looking at max exit velocity data from the 2020 season. This visualization offers a clear and detailed view of how max exit velocities are distributed among players and a smoothed density estimate to reveal underlying trends. My first observation is amazement at how hard these balls are being hit. It is truly astonishing.
Forget batting average; this metric is more diagnostic than many others that are typically (especially historically) referenced. If you are putting a team together, you want players who hit the ball hard. And yes, the harder the better. This line of reasoning is all about a player’s ceiling; it has nothing to do with the dribbling groundballs that find a spot between defenders. Such “seeing eye” base hits are of little predictive value.
In 2020, exit velocity data’s importance escalated as teams began using it for more refined scouting and player development decisions. This season saw an exceptionally high interest in advanced metrics, partly because of the pandemic-shortened season. This led teams and analysts to seek more data-driven insights into player performance.
I used a histogram with an overlayed density curve to visualize max exit velocity data. Here’s what each part of this plot conveys:
A histogram with a density curve provides a quantitative view of max exit velocity data. This visualization helps scouts, coaches, and analysts quickly assess the distribution of max exit velocities across players. The density curve also offers a smooth, continuous view of the data, making it easier to observe trends and concentrations without the constraints of bin width.
This histogram with a density overlay captures a snapshot of the league’s hitting power, revealing the typical max exit velocities and highlighting exceptional outliers.
This exemplifies how data analytics can deepen our understanding of baseball. By looking beyond averages and focusing on distribution, we gain a richer perspective on the league’s players. Whether you’re a data enthusiast or a baseball fan, this analysis offers a powerful glimpse into the metrics driving modern baseball.
It was one of those nights when Daniel felt the weight of his existence pressing down on him. Everyone in his circle had conspired to make him feel small and insignificant, and he realized they had won. His guitar, a sunburst Telecaster, sat propped against the corner of his cluttered apartment, its wooden body glowing dimly in the light of a single table lamp. The coffee table was littered with takeout boxes, sheet music, and rejection letters from record labels. He hadn’t played a gig in months, and even when he did, no one cared.
“Just another face in a sea of struggling musicians,” he muttered, kicking an empty can of beer across the room. He knew that when he died, there would be little evidence that he ever lived. He flopped onto his couch, staring at the ceiling.
Daniel had dreamt of being a musician ever since he could remember, but the universe had other plans. The gigs that came through were sparse and unpaid, his songwriting was stagnant and derivative, and his social media accounts were filled with dismal and indifferent silence. He scrolled through his phone, looking at pictures of famous musicians, the people he envied and tried to emulate. Their lives seemed effortlessly glamorous—beautiful women, sleek cars, sold-out shows. How often do those people have to worry about coming up with the rent? What would it be like to be someone like that?
The thought lingered as he set his phone down and reached for his guitar.
The moment his fingers brushed the strings, something strange happened. He felt a jolt of static shoot up his arm. He flinched, shaking his hand, but the sensation faded almost as quickly as it had come. Weird. He shrugged it off and tuned the guitar, plucking each string with expert precision.
The first chord he played was a G major, the quintessential cowboy chord, a familiar sound that usually brought him some comfort. But tonight, it felt… different. The notes hung in the air longer than usual, vibrating through his skull as if the sound had turned physical. It was then that Daniel noticed the room had begun to shift. His fingers kept moving, strumming a melody he didn’t recognize, his body acting independently.
The walls blurred, and his vision seemed to stretch and twist, pulling him through some invisible tunnel. His fingers kept strumming, and he kept playing the unknown song. And then, everything stopped.
Daniel blinked, finding himself standing in the middle of a crowded club. A stage with bright lights. The electric hum of an audience waiting in anticipation. He looked down at his hands. They were gripping a guitar—a Stratocaster that wasn’t his. The strings hummed beneath his fingers, a warm buzz of anticipation. But it wasn’t just the guitar that was different.
He was different.
Daniel stumbled back, his mind scrambling to understand what had just happened. A glance at the mirror behind the bar stopped him cold. He wasn’t looking at his own reflection. Staring back at him was someone else—a man with sharp cheekbones, styled dark hair, and a leather jacket that looked like it cost more than his monthly rent. His hands, calloused and weathered from years of playing, were smooth and adorned with rings.
“What the hell?” he whispered, his voice sounding foreign in his own ears.
A voice crackled over the speakers before he could fully process what was happening. “Ladies and gentlemen, give it up for John Wisher!”
The crowd erupted into cheers, and Daniel—or John, apparently—felt his legs carry him to the microphone. His body moved with an effortless swagger as if it knew exactly what to do. Muscle memory. Without thinking, he strummed the guitar, hung down much lower than he was used to, and began to play. The song flowed out of him effortlessly, like he had played it a thousand times before. His fingers danced along the fretboard, and John’s voice boomed through the speakers, captivating the crowd.
For a moment, he was lost in it. The music, the applause, the energy of the room. He felt alive in a way he hadn’t in years. But as the song ended and the cheers died, reality hit him like a punch. This wasn’t his life. This wasn’t his body. He was… someone else.
Panicking, Daniel rushed off the stage, ducking into the club’s back alley. His heart pounded in his chest, his mind racing. How was this possible? Was he dreaming? Was he dead?
He clutched the guitar tightly, his fingers trembling as he plucked the strings again, desperate to find a way back. The same strange melody came to his hands, unwelcome and unintentional, and the world around him began to warp again.
With a rush of sound and light, Daniel was back in his apartment, staring at his reflection. His heart hammered, but the relief was overwhelming. He was himself again.
For days, he avoided his Telecaster, afraid to touch it. The experience felt too real to be a hallucination, but he couldn’t make sense of it. Was it magic? Some kind of curse? He didn’t know. All he knew was that playing those notes had transported him into another person’s life.
But curiosity gnawed at him, whispering to him in the quiet moments. He couldn’t stop thinking about the rush of being John Wisher—the thrill of the crowd, the feeling of success. That was what he had always wanted, wasn’t it? To be someone? To live a life that mattered?
Finally, Daniel gave in.
Sitting on the edge of his bed, he picked up his sunburst Telecaster again, his fingers trembling as he played the same mysterious melody. Once more, the room warped and spun, and when the world settled, he was somewhere new.
This time, he was in a recording studio. His reflection in the glass showed a different man—a polished, clean-cut singer in his mid-30s, headphones around his neck, a crowd of producers nodding in approval from the other side.
The life he’d stepped into was equally glamorous. The day was a whirlwind of recording sessions, photo shoots, and catered dinners at expensive restaurants. For a while, it was everything Daniel had dreamed of. He felt important. Admired. Successful.
But as the days went by, something began to gnaw at him. Each time he returned to his own life, his apartment felt more foreign, more distant. The simple act of waking up as Daniel in his shabby apartment became painful. It was as if he had tasted something sweet, only to have it ripped away again.
He began to spend more and more time in other people’s lives. A rockstar in one life, a wealthy and prominent composer in another. With each guitar strum, he was someone new—someone better. But the more he switched, the harder it became to remember who he really was. He would wake up in a stranger’s body and struggle to recall his own face. His own name.
Soon, the lines began to blur. He would return to his apartment after a week spent as some famous DJ, only to feel like he was stepping into a stranger’s home. He no longer felt like Daniel. He no longer wanted to be Daniel.
One night, after an especially wild show as the frontman of an explosive punk group, Daniel—or the person who had once been Daniel—sat in a luxurious hotel room, staring at the Strat. His fingers trembled as he picked it up again, the strings humming softly. He couldn’t remember the last time he had been himself, and he didn’t want to go back.
His life memories were fading like distant dreams—shadows of another existence. He could barely recall his face in the mirror or the sound of his voice.
As he played the familiar melody, the room began to spin, and he smiled. He no longer cared where the guitar would take him as long as he never had to return to the emptiness of his old life.
The last chord faded, and Daniel disappeared, swallowed by the endless stream of lives he would never fully belong to, lost in a symphony of borrowed faces and forgotten names.
In a state of existential despair, Daniel hoped to “become music” and live an infinite supernatural existence. All I know, all that anyone knows, is that if you visit a run-down building in the southern part of Iroquois County, Ohio, you will find a sunburst Telecaster in the corner of a dusty, abandoned apartment, waiting for its next player.
![]()
When I think about baseball, arm strength is one of the first things that comes to mind—especially when comparing players across different positions. Whether it’s a third baseman making a quick throw across the diamond (Brooks Robinson, anyone?) or an outfielder firing a rocket from the warning track (Roberto Clemente was awesome), a strong and accurate arm can make all the difference. Recently, I dove into some data from Major League Baseball covering the years 2020 to 2024 to better understand how arm strength varies by position, and I’d like to share what I found.
Comparing Average Arm Strength Across Positions
I started by looking at the average arm strength for each position. Unsurprisingly, outfielders—particularly those in right field—have the strongest arms, while positions like first base require less power behind the throw.
This bar chart shows the average arm strength for each position (excluding catcher) in miles per hour. Outfielders (RF, CF, LF) clearly lead the way, with center fielders and right fielders consistently throwing the hardest. It makes sense: outfielders must make long throws back into the infield, often in critical situations where arm strength is key.
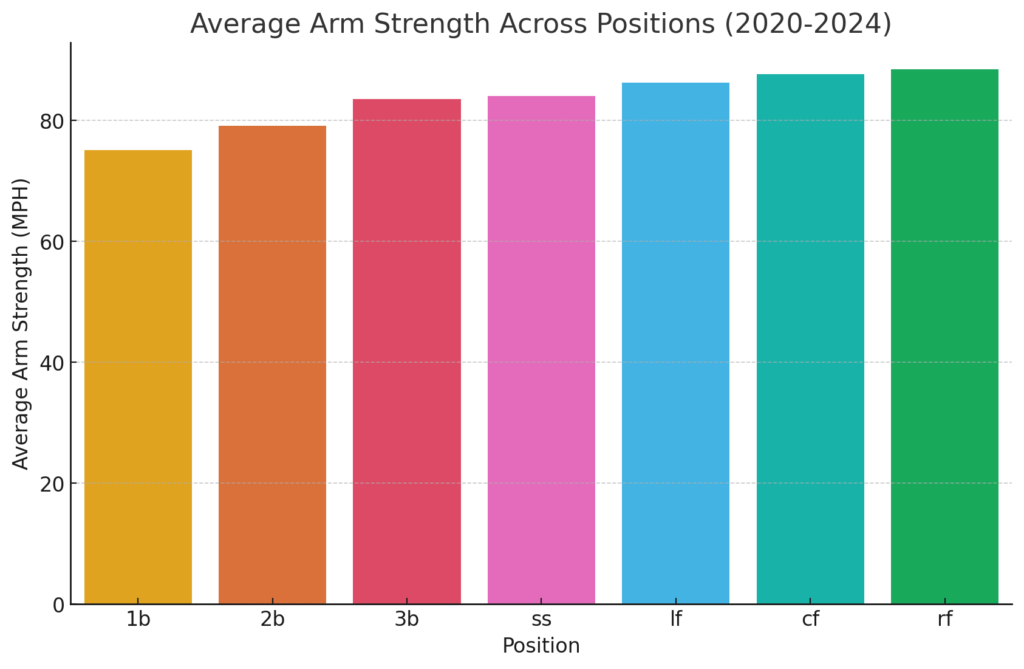
Are you surprised? I might have thought that shortstops would have edged out left fielders and maybe even center fielders. That said, it is close.
As always, box plots allow us to get a more granular view of the raw data. Here is what I found.
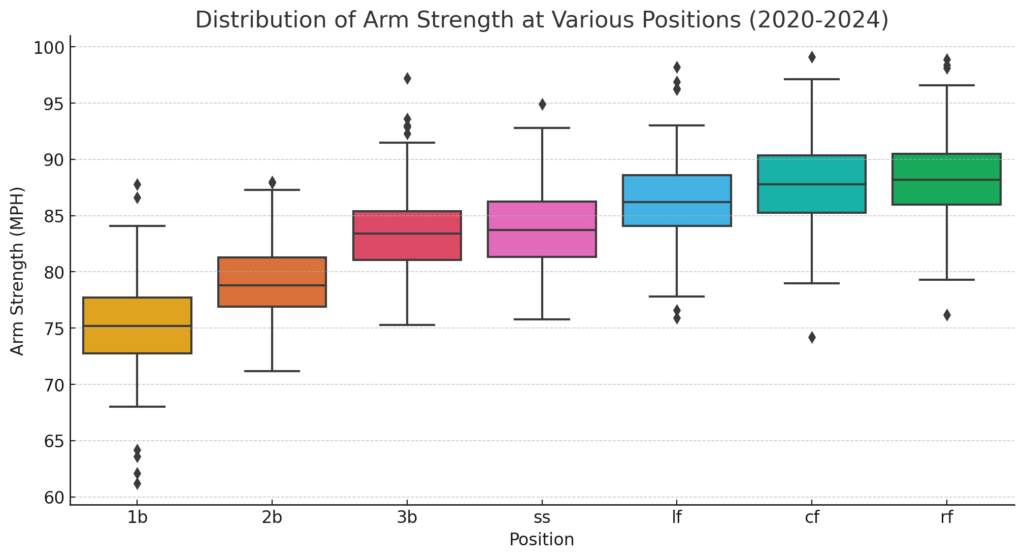
Notice the outliers among first basemen. Lots of them get very little on their throws. That is unsurprising; many players are positioned there for their offense, with defense being an afterthought.
As readers of this blog know, I have a special relationship with violin plots. Here is the same data in that form.
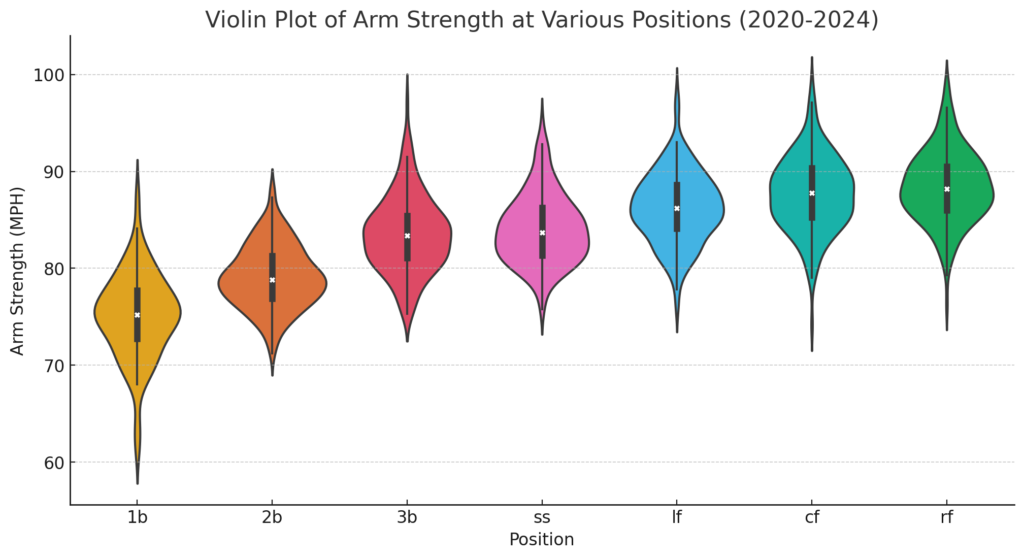
Once again, the poor arms of a select group of first basemen are highlighted. I consider that fact to be a big takeaway from this plot.
Infield vs. Outfield: A Clear Difference
Next, I wanted to break things down further and compare infielders’ arm strength versus outfielders. Unsurprisingly, outfielders, who cover more ground and make longer throws, generally have stronger arms.
The box plot below shows the distribution of arm strength between infield and outfield players. Outfielders not only have higher average arm strength, but the range of arm strength is more comprehensive, too. Some outfielders, particularly those in right field, can really get after it when a runner is rounding second.
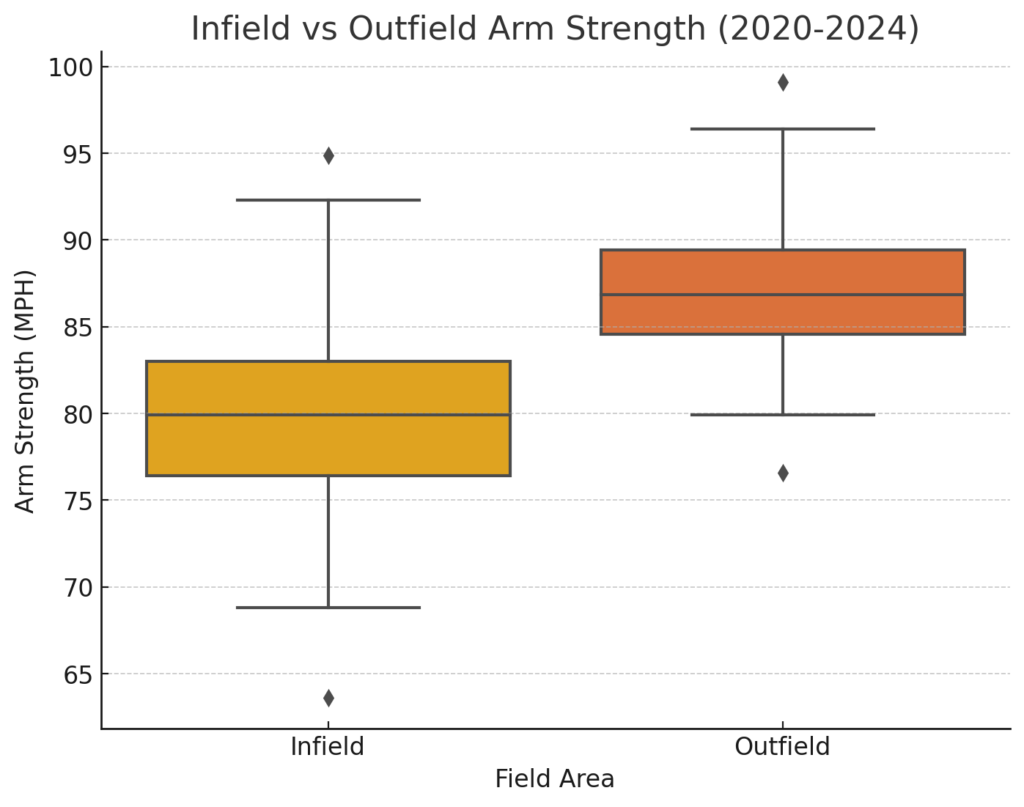
I would like to tell you something interesting about this plot. Over 35 years ago, I was taught a trick (more properly, a heuristic) at Harvard University. If there is a space between the bodies of the box plots, then the data set is worthy of further exploration. If you look closely, you can see a thin space between the boxes, so I decided to investigate further to see if the differences in arm strength are statistically significant. We will get to that in a bit.
Looking for Patterns: Correlations Between Positions
Before we get to the hard-core statistics, I wanted to explore whether there is a relationship between arm strength at different positions. For instance, do shortstops tend to have arm strength similar to that of second basemen or third basemen? To find out, I ran a correlation analysis.
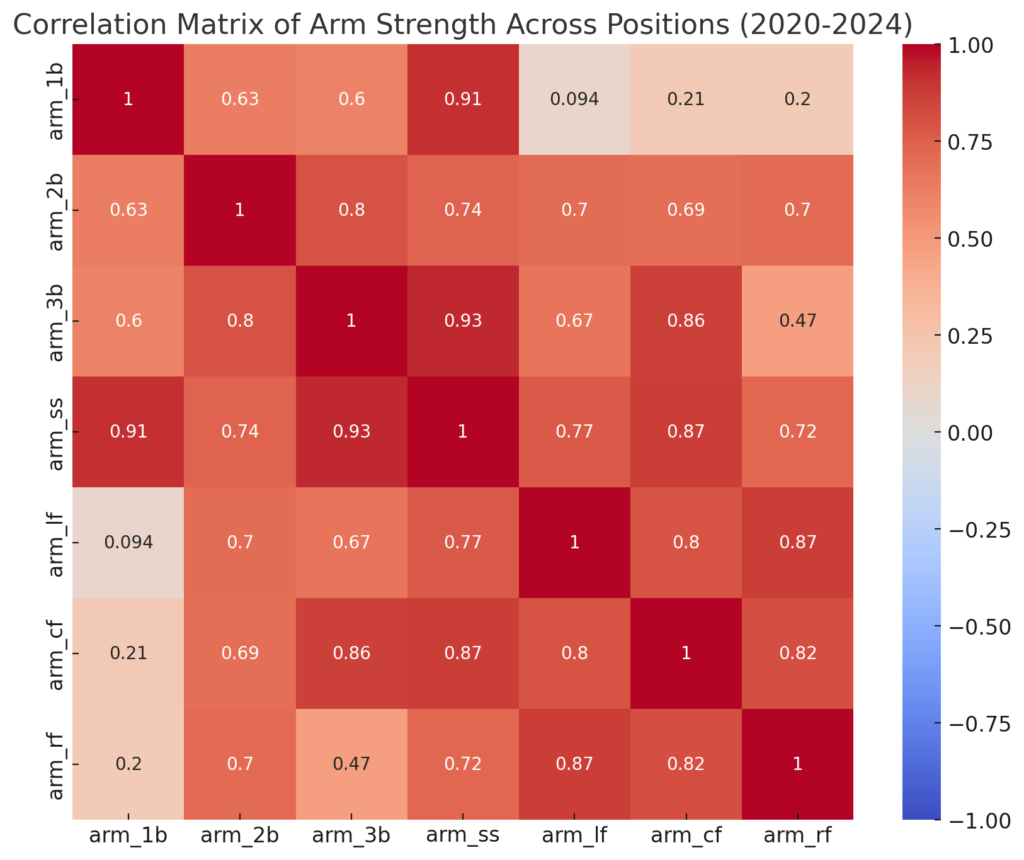
This heatmap shows how arm strength at one position correlates with another. There are some interesting patterns here—positions like second base (2B) and shortstop (SS) show a strong correlation, likely because they both require quick, strong throws in the infield. The outfield positions also show high correlations with each other, which makes sense given the similar demands placed on their arms.
Here are the Statistics
The results of the one-way ANOVA test (a comparison of variance amongst means) indicate the following:

Since the p-value is extremely small (well below the typical significance and totally arbitrary threshold of 0.05), we can reject the null hypothesis. This suggests statistically significant differences in arm strength across the different positions. In other words, the differences in arm strength are authentic and valid.
I have never done this before in my blog, but I decided to take an even deeper dive into this data set. I view this blog as more or less an introduction to what I find interesting. I don’t want to get into the weeds; many blogs and websites do that. Today, though, is different. Early this morning, I ran my 4 miles despite not wanting to get out of bed. My hip, which needs to be replaced, barked the entire time. I guess I am in a mood… Here is what I did next.
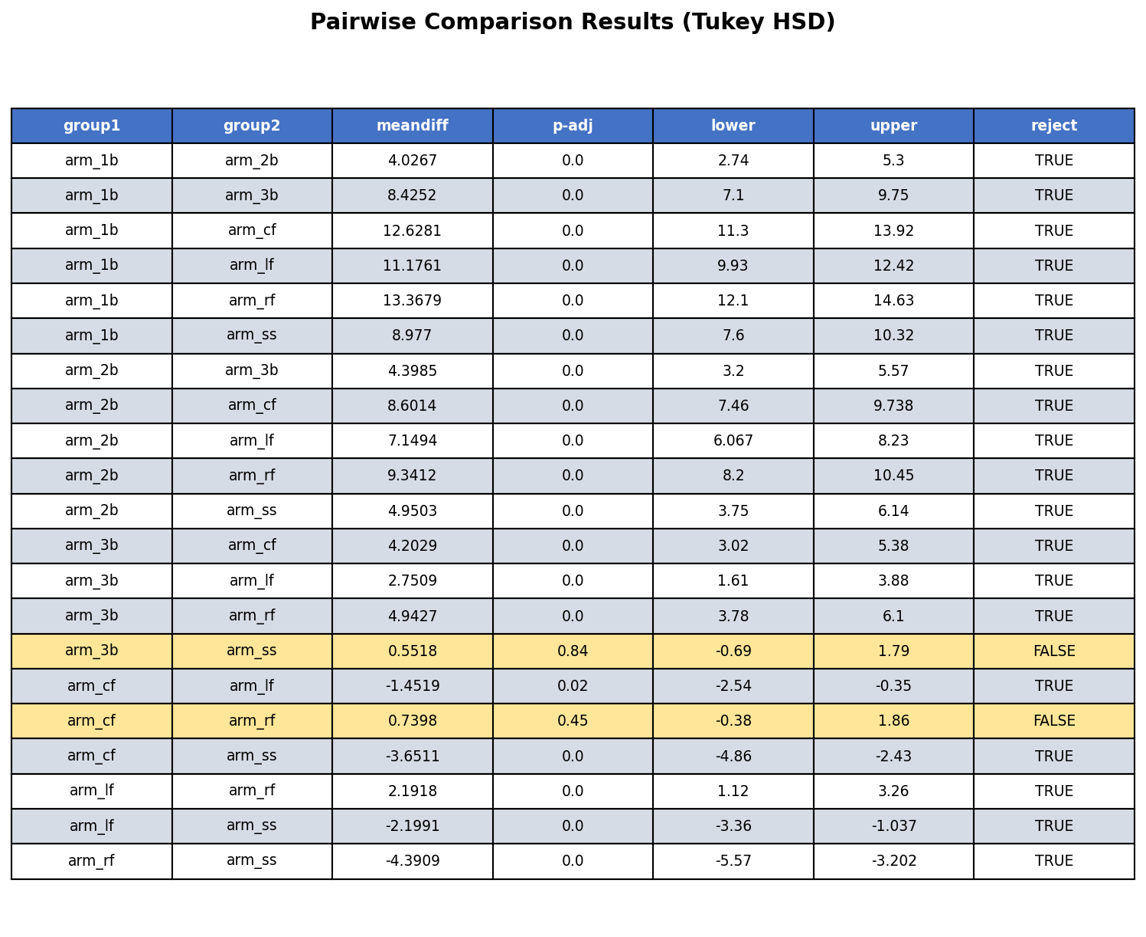
These are the results from Tukey’s HSD (Honestly Significant Difference) test results that provide pairwise comparisons between arm strengths for different positions. Yeah, I know your eyes are glazing over, but bear with me. Here’s how to interpret the key columns:
Even though my hip is killing me, I feel very good about the results of this study.
Wrapping Up
So, what did I learn from all this? First, outfielders—especially those in right and center field—are in a league of their own regarding arm strength. Conversely, infielders don’t need the same power, but positions like third base and shortstop still require strong arms for those quick, long throws.
Running the ANOVA and Tukey’s test confirmed that these differences in arm strength are not random results due to the vagaries of sampling. Understanding these variations can be crucial for teams looking to optimize their defensive lineups or scout new talent.
Examining the data and seeing how arm strength varies across MLB positions was fascinating. I hope you enjoyed it. I am going to grab a beer and contemplate the disappointment of my team, the Cleveland Guardians, disastrously ending another year. Meh, what else is new?
![]()