Introduction
The WAR validation chapter tested the full two-dimensional model.
It asked whether our third-base z-score framework could predict total player value. The answer was yes. Offensive z-scores predicted WAR. Traditional defensive z-scores added substantial explanatory power. The combined model performed especially well at the career level.
But WAR is broad.
WAR includes offense, defense, baserunning, positional adjustment, replacement level, and playing time. That makes it useful, but it also makes it complex. If the question is whether our offensive z-score model really measures offensive quality, WAR is not the cleanest validation target.
For that, we need an offense-only benchmark.
That is where wRC+ becomes useful.
FanGraphs wRC+ is designed to measure offensive production relative to league and park context, with 100 as league average. A 120 wRC+ means a hitter was about 20 percent better than league average. An 80 wRC+ means about 20 percent below league average.
So the validation question becomes simple:
Does our Model C offensive z-score predict FanGraphs wRC+?
The answer is yes.
Among third-base regulars with at least five qualified third-base seasons, the average Model C offensive score per qualified season explains a large share of career wRC+ variation:
wRC^+ = 100.89 + 5.41(\text{Model C Offensive Score per Qualified Season}) R^2 = 0.740That is a strong relationship.
Just as important, the traditional defensive score does not meaningfully predict wRC+:
R^2 = 0.022That negative-control result matters. It tells us that the offensive z-score model is not simply measuring general player quality. It is measuring offense.
Why wRC+ Is the Right Validation Target
The earlier WAR validation was a broad test.
It asked:
Do our offense-defense scores predict total value?
This chapter asks something narrower:
Does our offensive z-score predict an established offensive metric?
That is a cleaner test of Model C.
The offensive z-score model was built from same-position, same-season peer comparisons. It was not designed to reproduce wRC+. It does not directly use the same run-value formula. It does not include park adjustments in the same way. It includes runs and RBI, which wRC+ does not treat as independent batter skills in the same way. It includes baserunning through net stolen bases, while wRC+ is focused on hitting.
Even so, the relationship is strong.
That is useful validation.
It means Model C is not just producing interesting internal rankings. It is also aligned with an external offensive measure.
Data Used in the Study
The FanGraphs file used for this chapter was a career batting leaderboard export. Because the file was career-level rather than season-level, this first wRC+ validation is a career-level study.
The merge was very successful.
The third-base career dataset included: 897 third-base players
The FanGraphs wRC+ merge matched: 786 of 897 players
Among regular third basemen, defined as players with at least five qualified third-base seasons, the merge matched: 239 of 240 players
That gives us a strong sample for the validation test.
The main analysis focuses on the regulars because wRC+ is a rate statistic, and very short careers can create noisy results. A five-qualified-season cutoff helps identify players with enough third-base playing time to make the comparison meaningful.
The Model C Offensive Score
The offensive score used in this validation is the same Model C score used throughout the third-base study.
Model C uses seven offensive components:
OBP

ISO

BB/PA

SO/PA, inverted

Net SB/PA

R/PA

RBI/PA
The basic z-score formula is:
z = \frac{x - \mu}{\sigma}Where:
x = \text{the player's value} \mu = \text{the same-position, same-season peer-group mean} \sigma = \text{the same-position, same-season peer-group standard deviation}This equation asks a simple question:
How far above or below the third-base peer group was this player?
That is the core of the whole study.
Offensive Component Equations
On-base percentage is:
OBP = \frac{H + BB + HBP}{AB + BB + HBP + SF}Slugging percentage is:
SLG = \frac{TB}{AB}Isolated power is:
ISO = SLG - AVGWalk rate is:
BB/PA = \frac{BB}{PA}Strikeout rate is:
SO/PA = \frac{SO}{PA}Net stolen bases are:
NetSB = SB - CSNet stolen-base rate is:
NetSB/PA = \frac{SB - CS}{PA}Run rate is:
R/PA = \frac{R}{PA}RBI rate is:
RBI/PA = \frac{RBI}{PA}The strikeout component is inverted because fewer strikeouts are better:
z_{\text{Low SO/PA}} = -\left( \frac{ (SO/PA)_i - \overline{(SO/PA)}_{\text{peer}} }{ s_{SO/PA,\text{peer}} } \right)The full Model C offensive season score is:
\begin{aligned} \text{Season Score} &= z_{\text{OBP}} + z_{\text{ISO}} + z_{\text{BB/PA}} + z_{\text{Low SO/PA}} \\ &\quad + z_{\text{NetSB/PA}} + z_{\text{R/PA}} + z_{\text{RBI/PA}} \end{aligned}This produces one offensive score for each qualified third-base season.
Playing-Time Weighting
The broader study uses a playing-time weight so that a partial season does not count the same as a full season.
The weight is:
w = \min\left(1, \frac{PA}{600}\right)The weighted season score is:
\text{Weighted Offensive Season Score} = \text{Model C Offensive Season Score} \times wThe career offensive score is:
\text{Career Offensive Score} = \sum_{s=1}^{n} \text{Weighted Offensive Season Score}_sThis career score is cumulative. It rewards repeated separation from third-base peers.
But wRC+ is not cumulative. It is a rate-style offensive measure. That creates an important methodological issue.
Why We Use Average Offensive Score per Qualified Season
Because wRC+ is rate-based, the best predictor is not simply total career offensive score.
A player with many seasons can accumulate a large career score even if his average season was not historically great. Another player with fewer seasons can have a higher offensive level but a lower accumulated score.
So for this validation, the primary predictor is:
\text{Average Offensive Score} = \frac{ \text{Career Offensive Score} }{ \text{Qualified Third-Base Seasons} }Or:
\text{Average Offensive Score} = \frac{ \sum_{s=1}^{n} \text{Weighted Offensive Season Score}_s }{ n }Where:
n = \text{number of qualified third-base seasons}This gives us an offensive quality measure rather than a pure accumulation measure.
That distinction matters.
The cumulative career offensive score still predicts wRC+, but not as well as the average score.
For third-base regulars:
Average offensive score per qualified season:
R² = 0.740

Cumulative career offensive score:
R² = 0.661
The average score is a better validation measure because it matches the rate-like nature of wRC+.
Regression Framework
The basic validation model is:
wRC^+_i = \alpha + \beta_1(\text{Average Offensive Score}_i) + \varepsilon_iWhere:
wRC^+_i = \text{FanGraphs career wRC+ for player } i \alpha = \text{intercept} \beta_1 = \text{effect of one additional average offensive z-score point} \varepsilon_i = \text{residual error}The fitted model for third-base regulars is:
wRC^+ = 100.89 + 5.41(\text{Average Offensive Score}) R^2 = 0.740This means that each additional point of average Model C offensive score is associated with about 5.41 points of career wRC+.
A player with an average offensive score of 0 projects near league average:
wRC^+ = 100.89 + 5.41(0) wRC^+ = 100.89A player with an average offensive score of 3 projects as:
wRC^+ = 100.89 + 5.41(3) wRC^+ = 117.12A player with an average offensive score of 6 projects as:
wRC^+ = 100.89 + 5.41(6) wRC^+ = 133.35This is exactly the kind of relationship we hoped to see.
Figure 1: Model Comparison
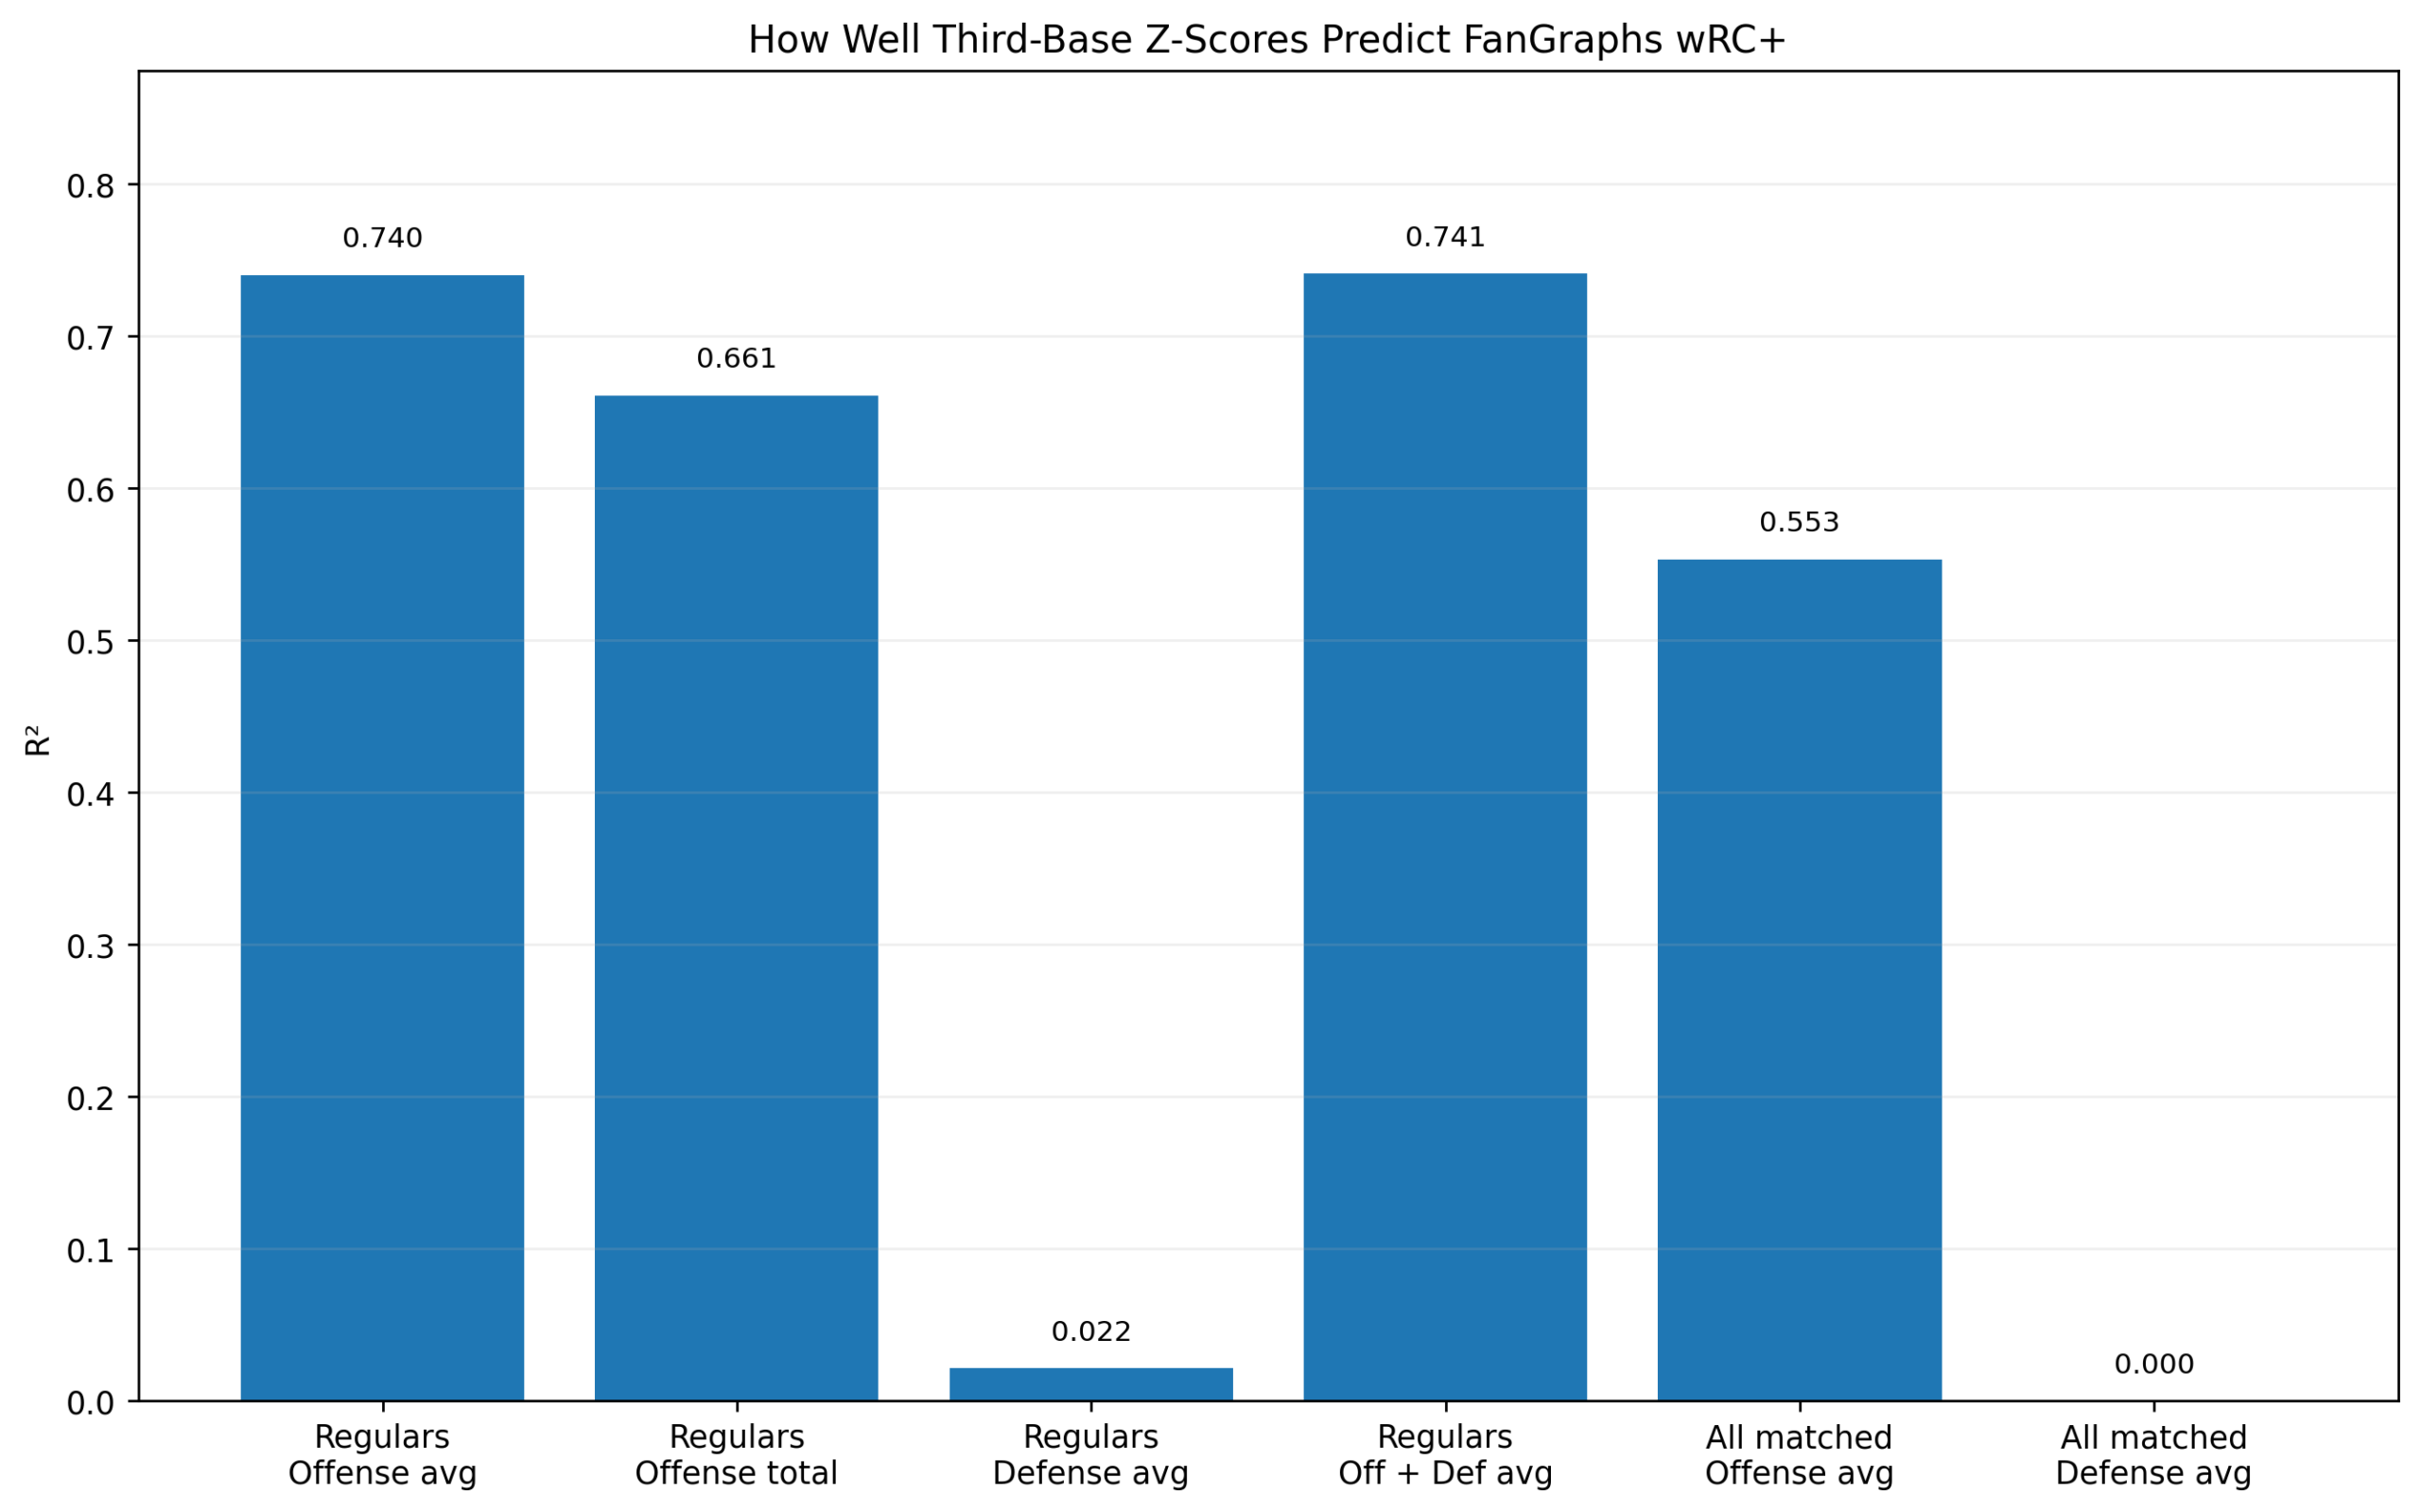
Figure 1. How well third-base z-scores predict FanGraphs wRC+.
The first figure compares the validation models.
The most important result is:
R^2 = 0.740for the average offensive score model among regular third basemen.
The cumulative offensive score also performs well:
R^2 = 0.661But the average score is better because wRC+ is a rate metric.
The traditional defensive score performs very poorly as a wRC+ predictor:
R^2 = 0.022That is not a problem. It is exactly what we want.
Defense should not predict wRC+ very well. If it did, that would suggest either a hidden confounding problem or a model that was mixing offensive and defensive signals.
The offense-plus-defense model is nearly identical to the offense-only model:
R^2 = 0.741That small difference tells us that traditional defense adds almost nothing to the prediction of wRC+. Again, this strengthens the interpretation.
The offensive model predicts offense. The defensive model does not.
Figure 2: Average Offensive Z-Score Versus wRC+
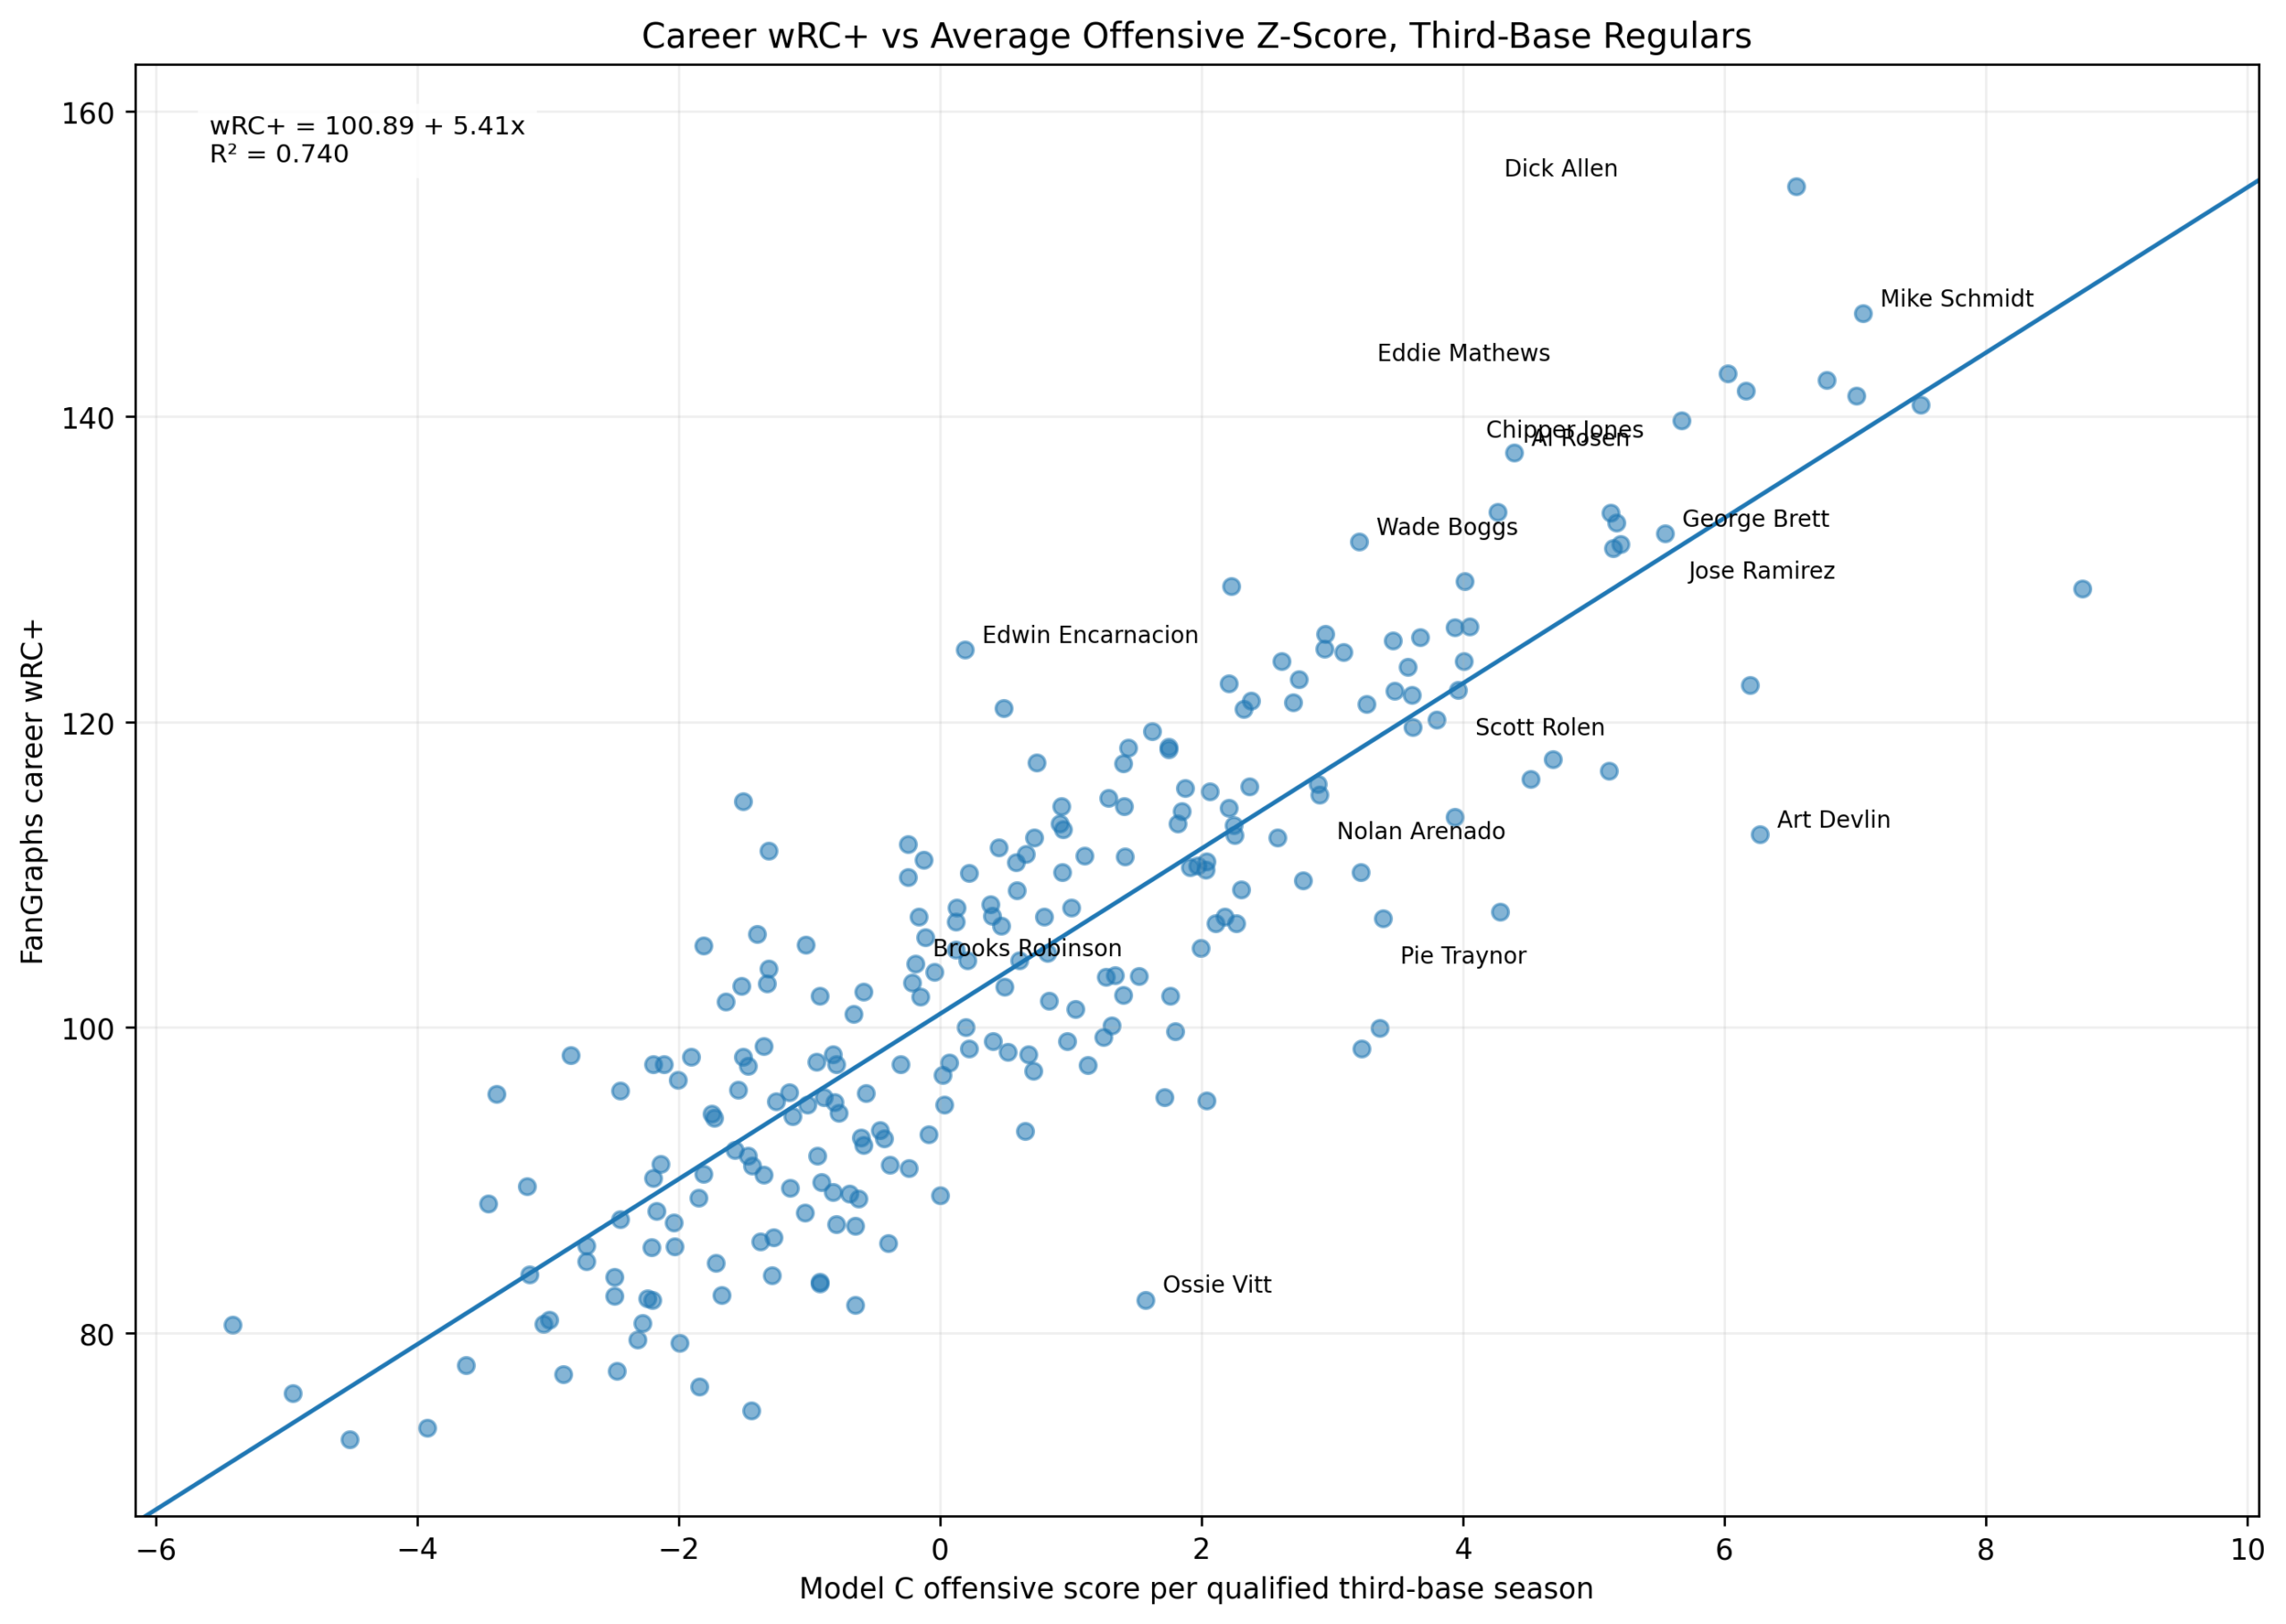
Figure 2. Career wRC+ versus average offensive z-score among third-base regulars.
The second figure shows the main relationship directly.
The x-axis is:
\text{Model C Offensive Score per Qualified Third-Base Season}The y-axis is:
wRC^+The fitted line is:
wRC^+ = 100.89 + 5.41x R^2 = 0.740The upward trend is clear.
Players with high average offensive z-scores tend to have high career wRC+ values. Mike Schmidt, Chipper Jones, Eddie Mathews, George Brett, Wade Boggs, Dick Allen, and Al Rosen all sit in the upper-right region. Players with lower offensive z-score averages tend to have lower wRC+ values.
This is a strong validation of Model C.
The z-score model is not simply rewarding raw counting totals. It is recovering a meaningful offensive signal that corresponds closely to an established offensive metric.
Figure 3: Actual Versus Predicted wRC+
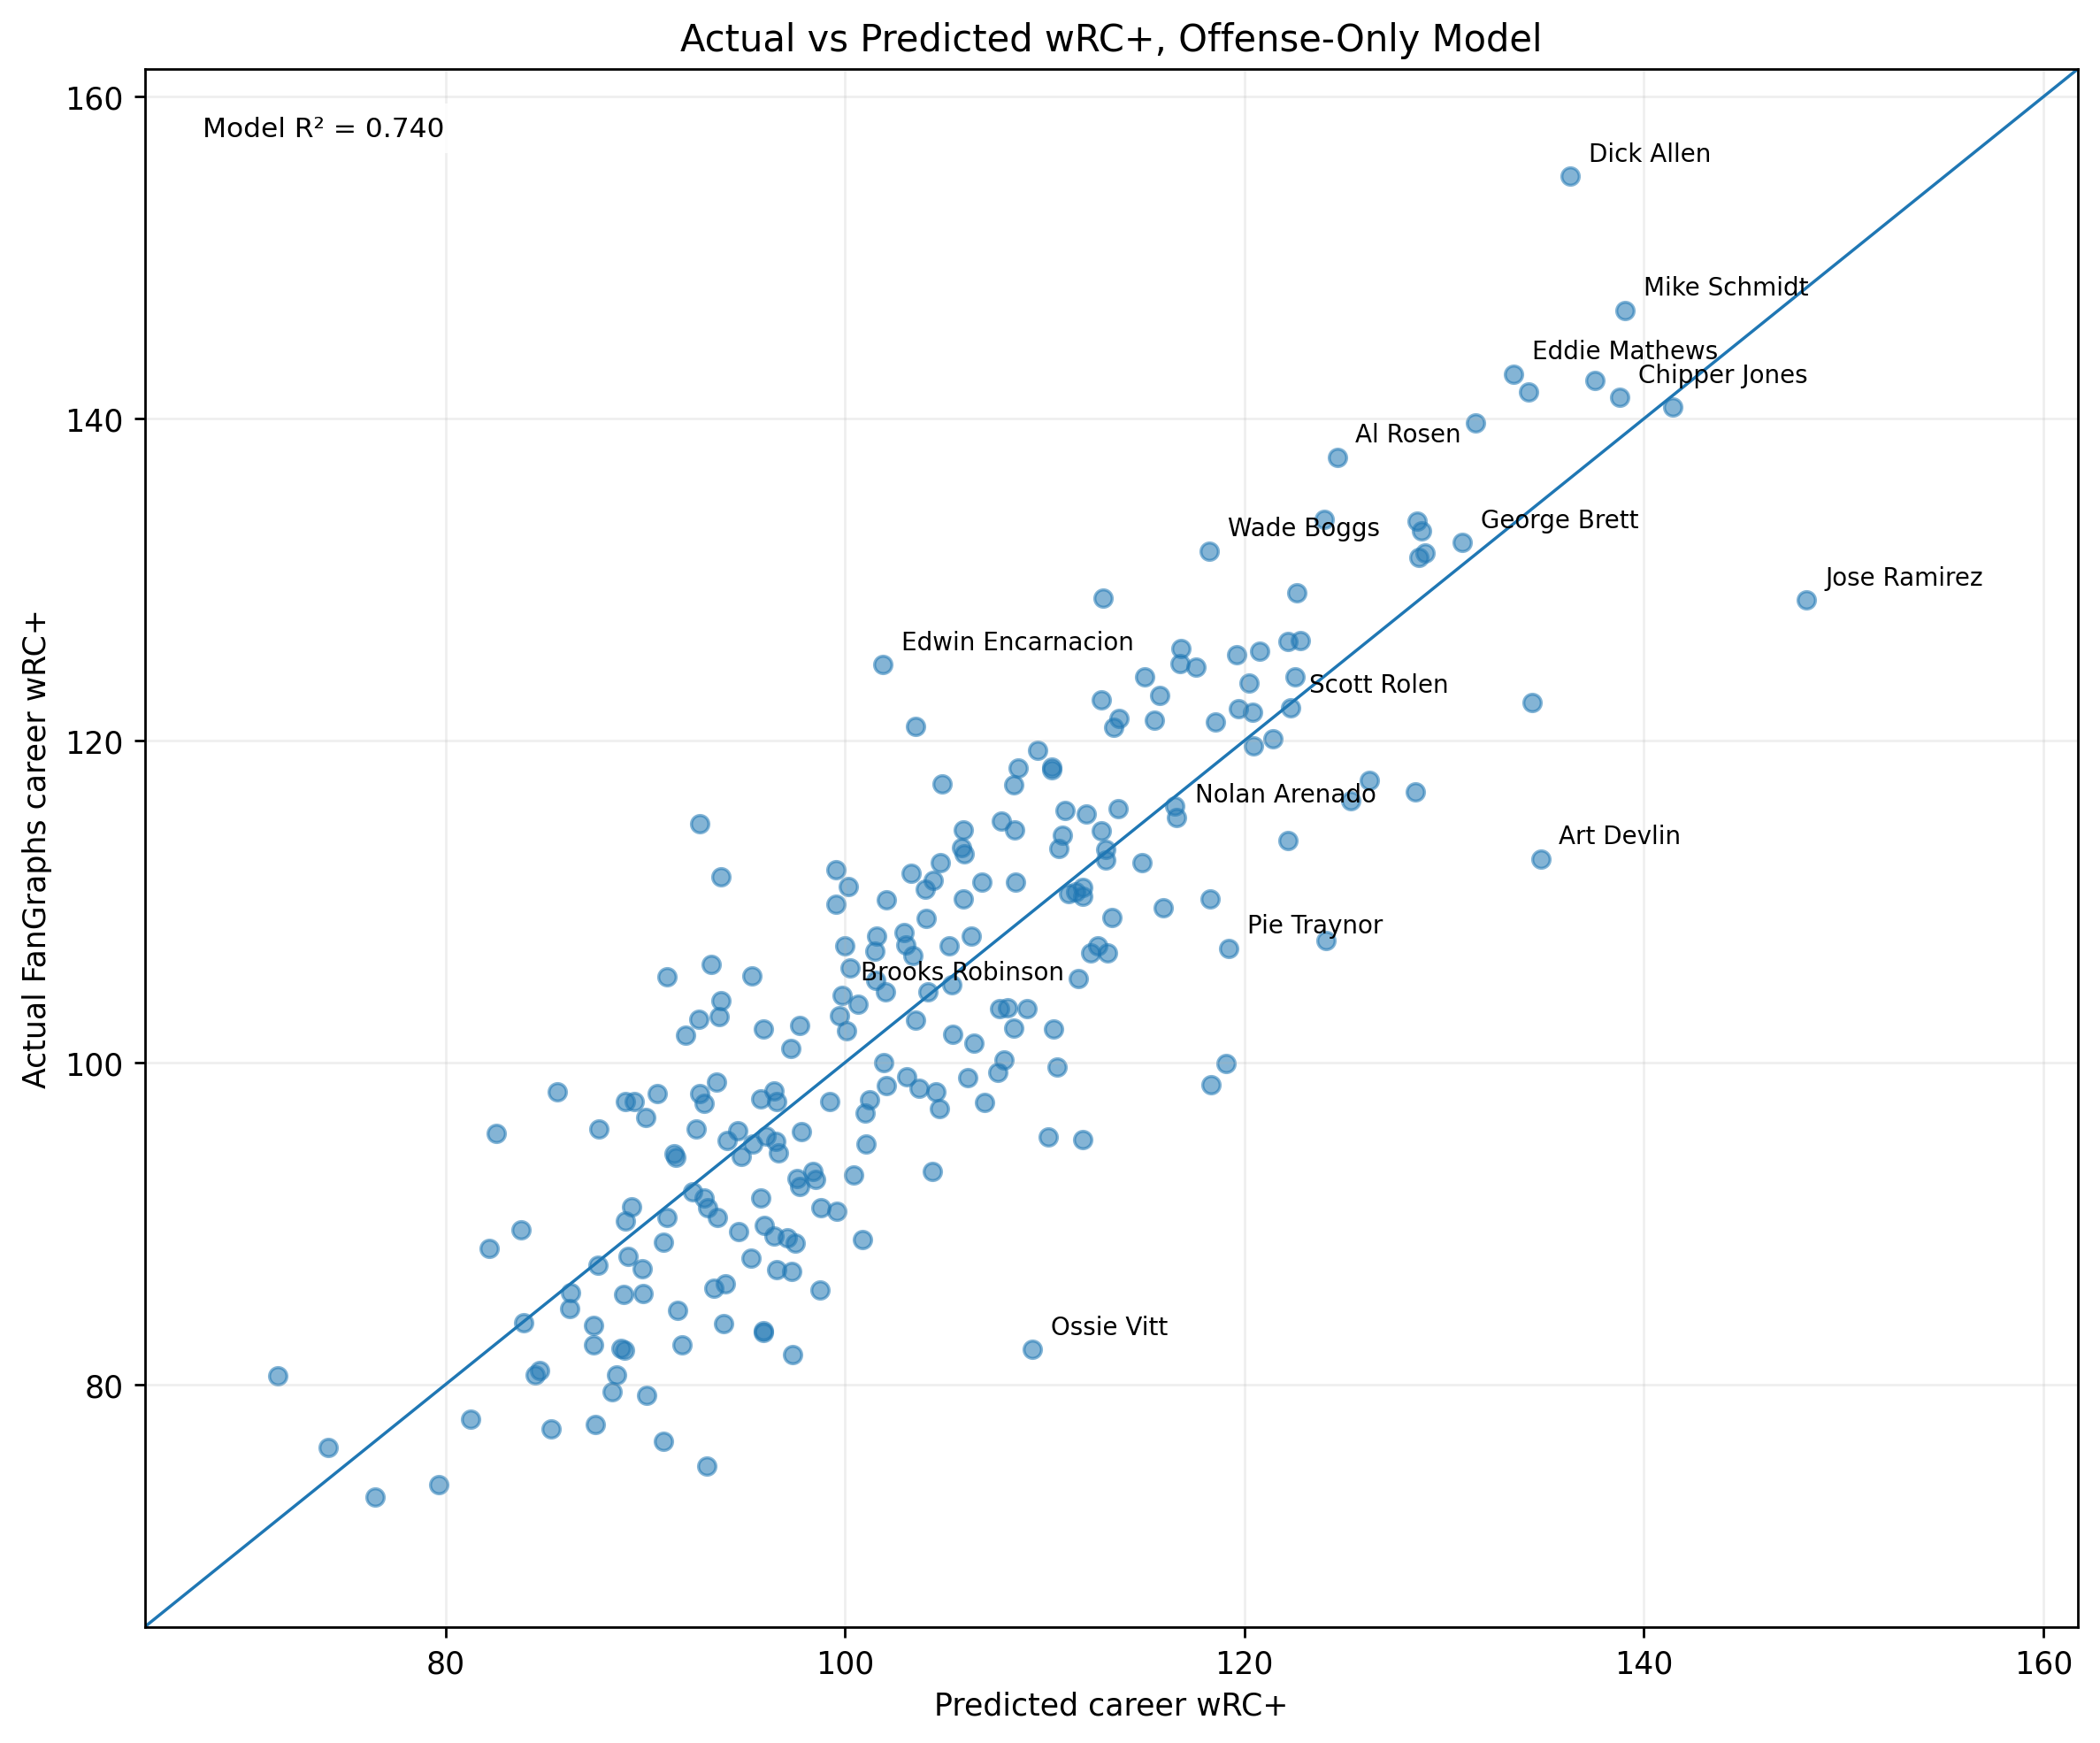
Figure 3. Actual versus predicted career wRC+ using the offense-only model.
The actual-versus-predicted plot shows how well the model estimates wRC+.
The prediction equation is:
\widehat{wRC^+} = 100.89 + 5.41(\text{Average Offensive Score})The residual is:
\text{Residual}_i = wRC^+_i - \widehat{wRC^+}_iPlayers near the diagonal are well predicted. Players above the diagonal have higher wRC+ than the model predicts. Players below the diagonal have lower wRC+ than the model predicts.
This figure shows that the model captures the broad structure very well, but it also shows useful outliers.
That is important.
The purpose of validation is not only to confirm that the model works. It is also to identify where it differs from an established metric.
Figure 4: The Defensive Negative Control
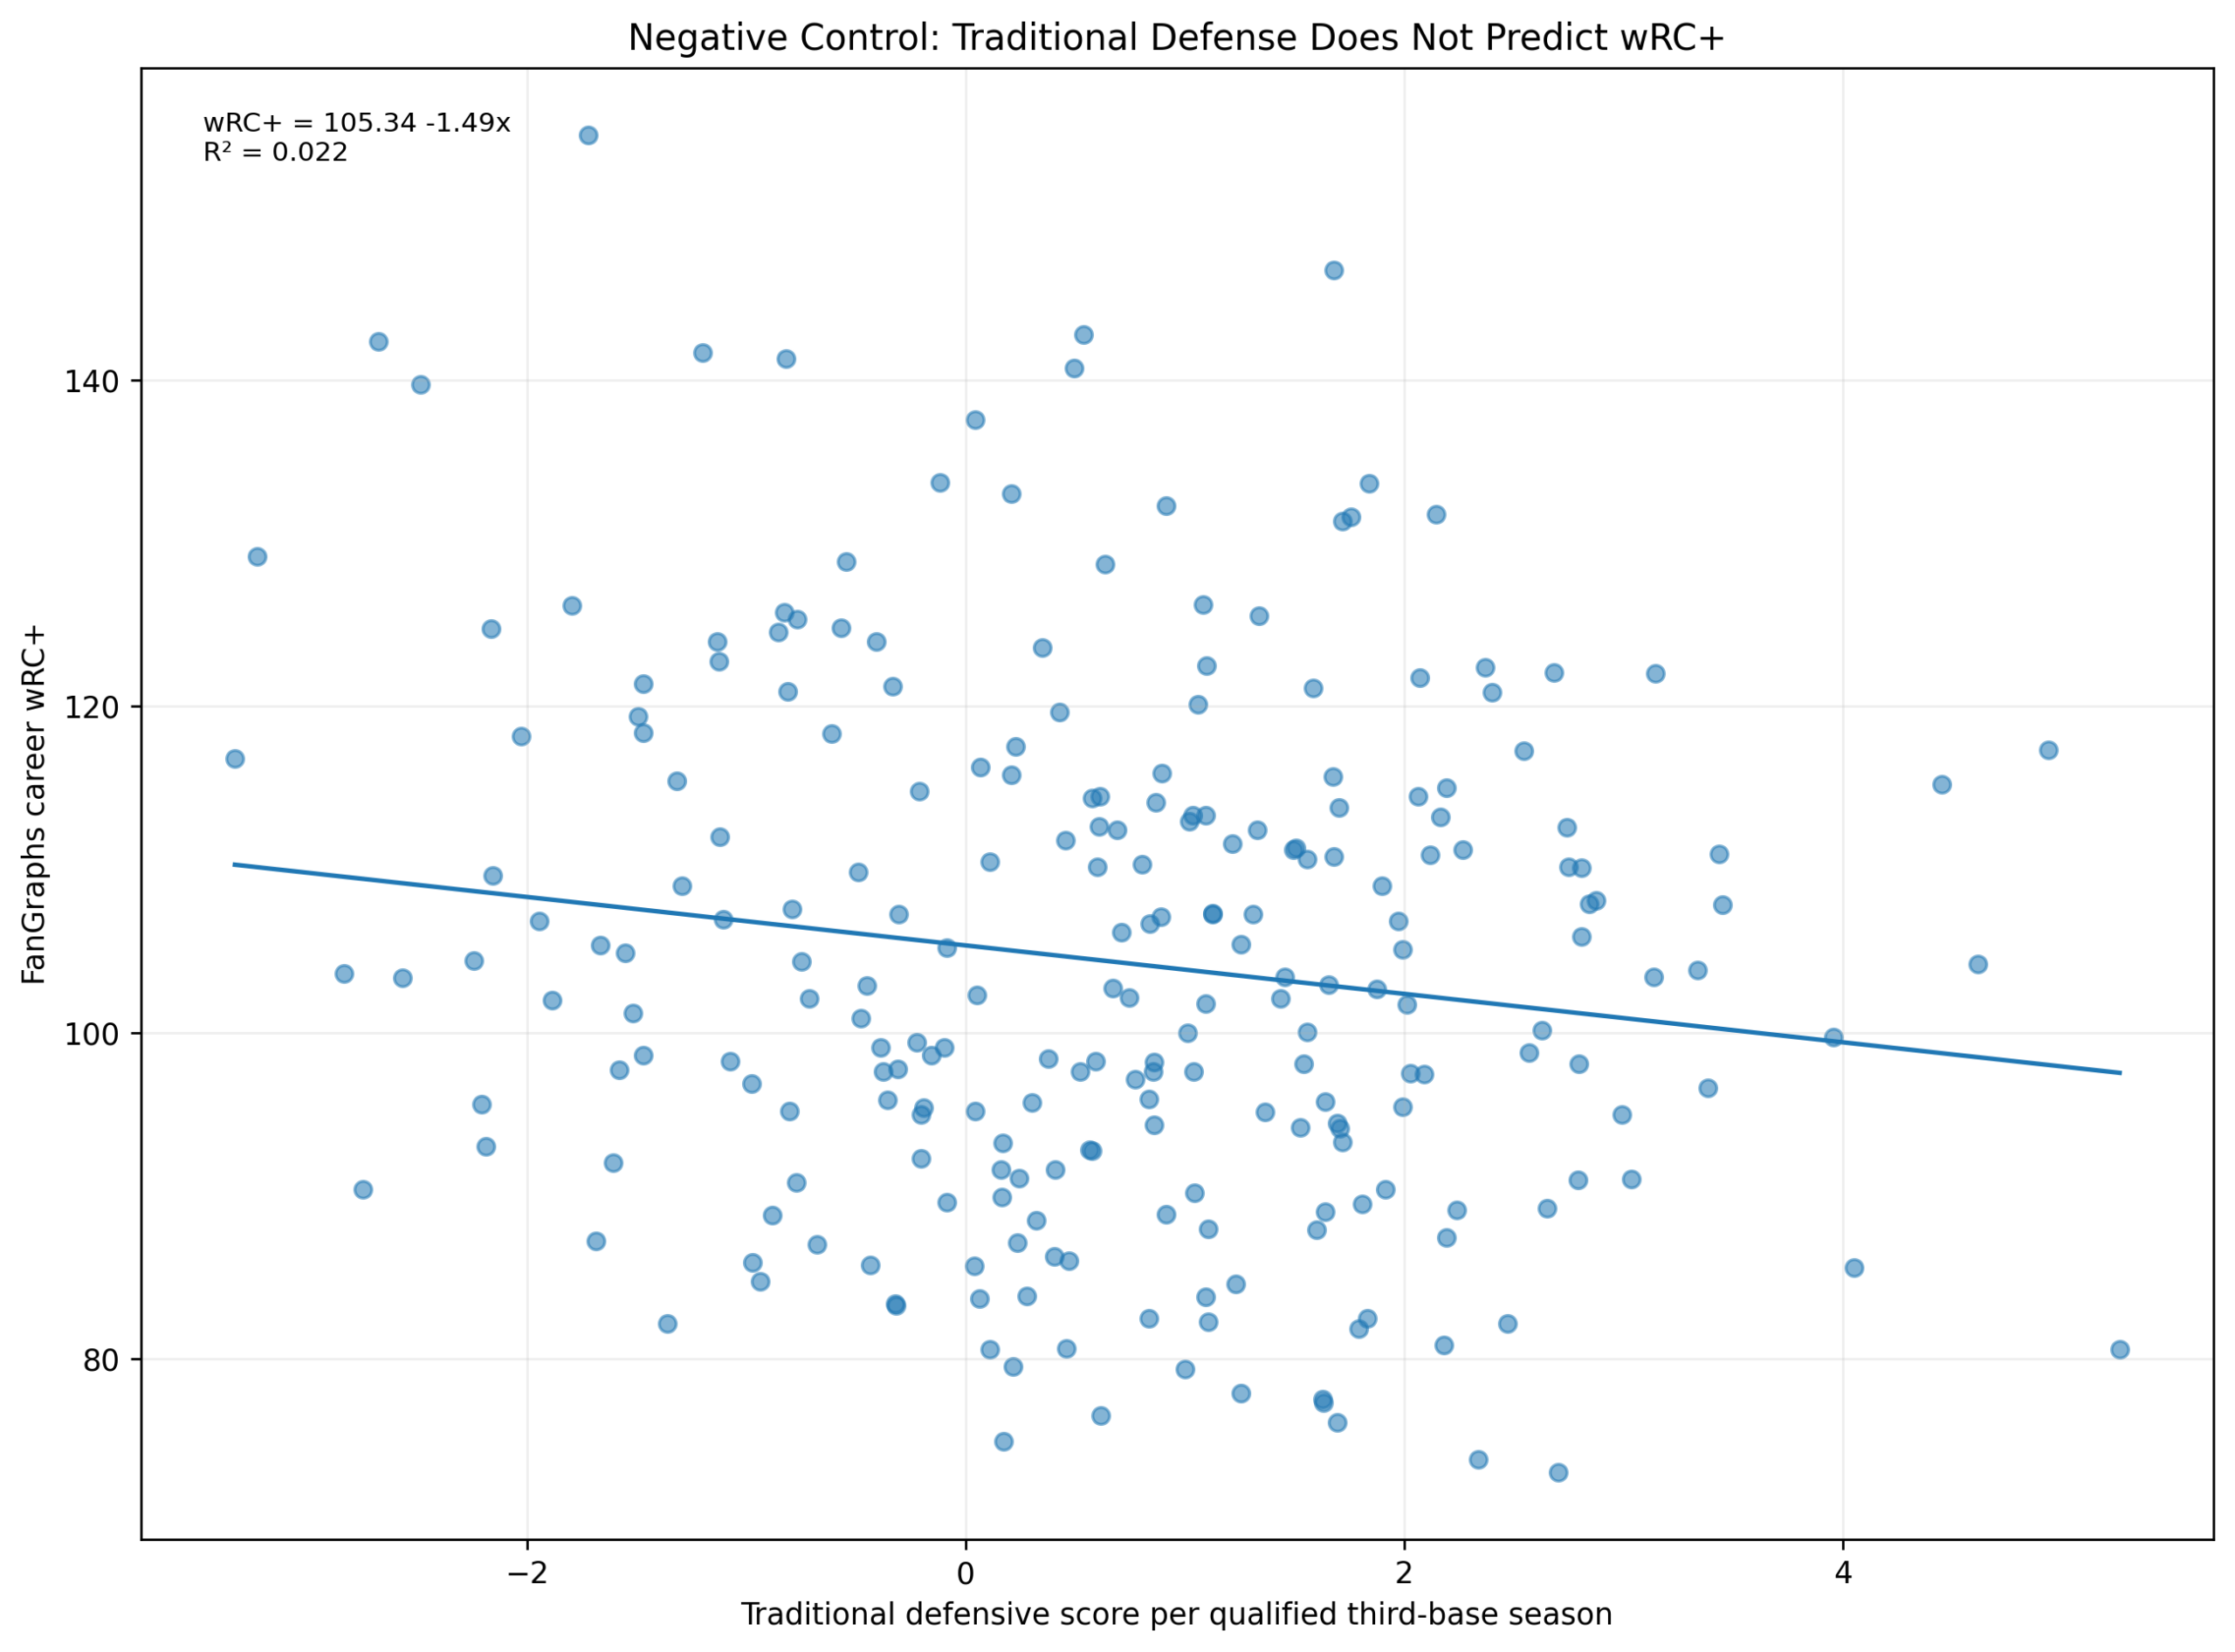
Figure 4. The traditional defensive score does not meaningfully predict wRC+.
The negative-control model is:
wRC^+ = \alpha + \beta_1(\text{Traditional Defensive Score per Qualified Season}) + \varepsilonThe fitted equation is:
wRC^+ = 105.34 - 1.49(\text{Traditional Defensive Score per Qualified Season}) R^2 = 0.022This means traditional defense explains only about 2.2 percent of the variation in career wRC+ among regular third basemen.
That is a very small relationship.
This is one of the most important findings in the chapter. It shows that the validation is specific. Offensive z-scores predict offensive value. Traditional defensive z-scores do not.
The negative-control test strengthens the model.
It tells us that Model C is not simply identifying famous players or good players in general. It is identifying an offensive quality.
Figure 5: Residuals
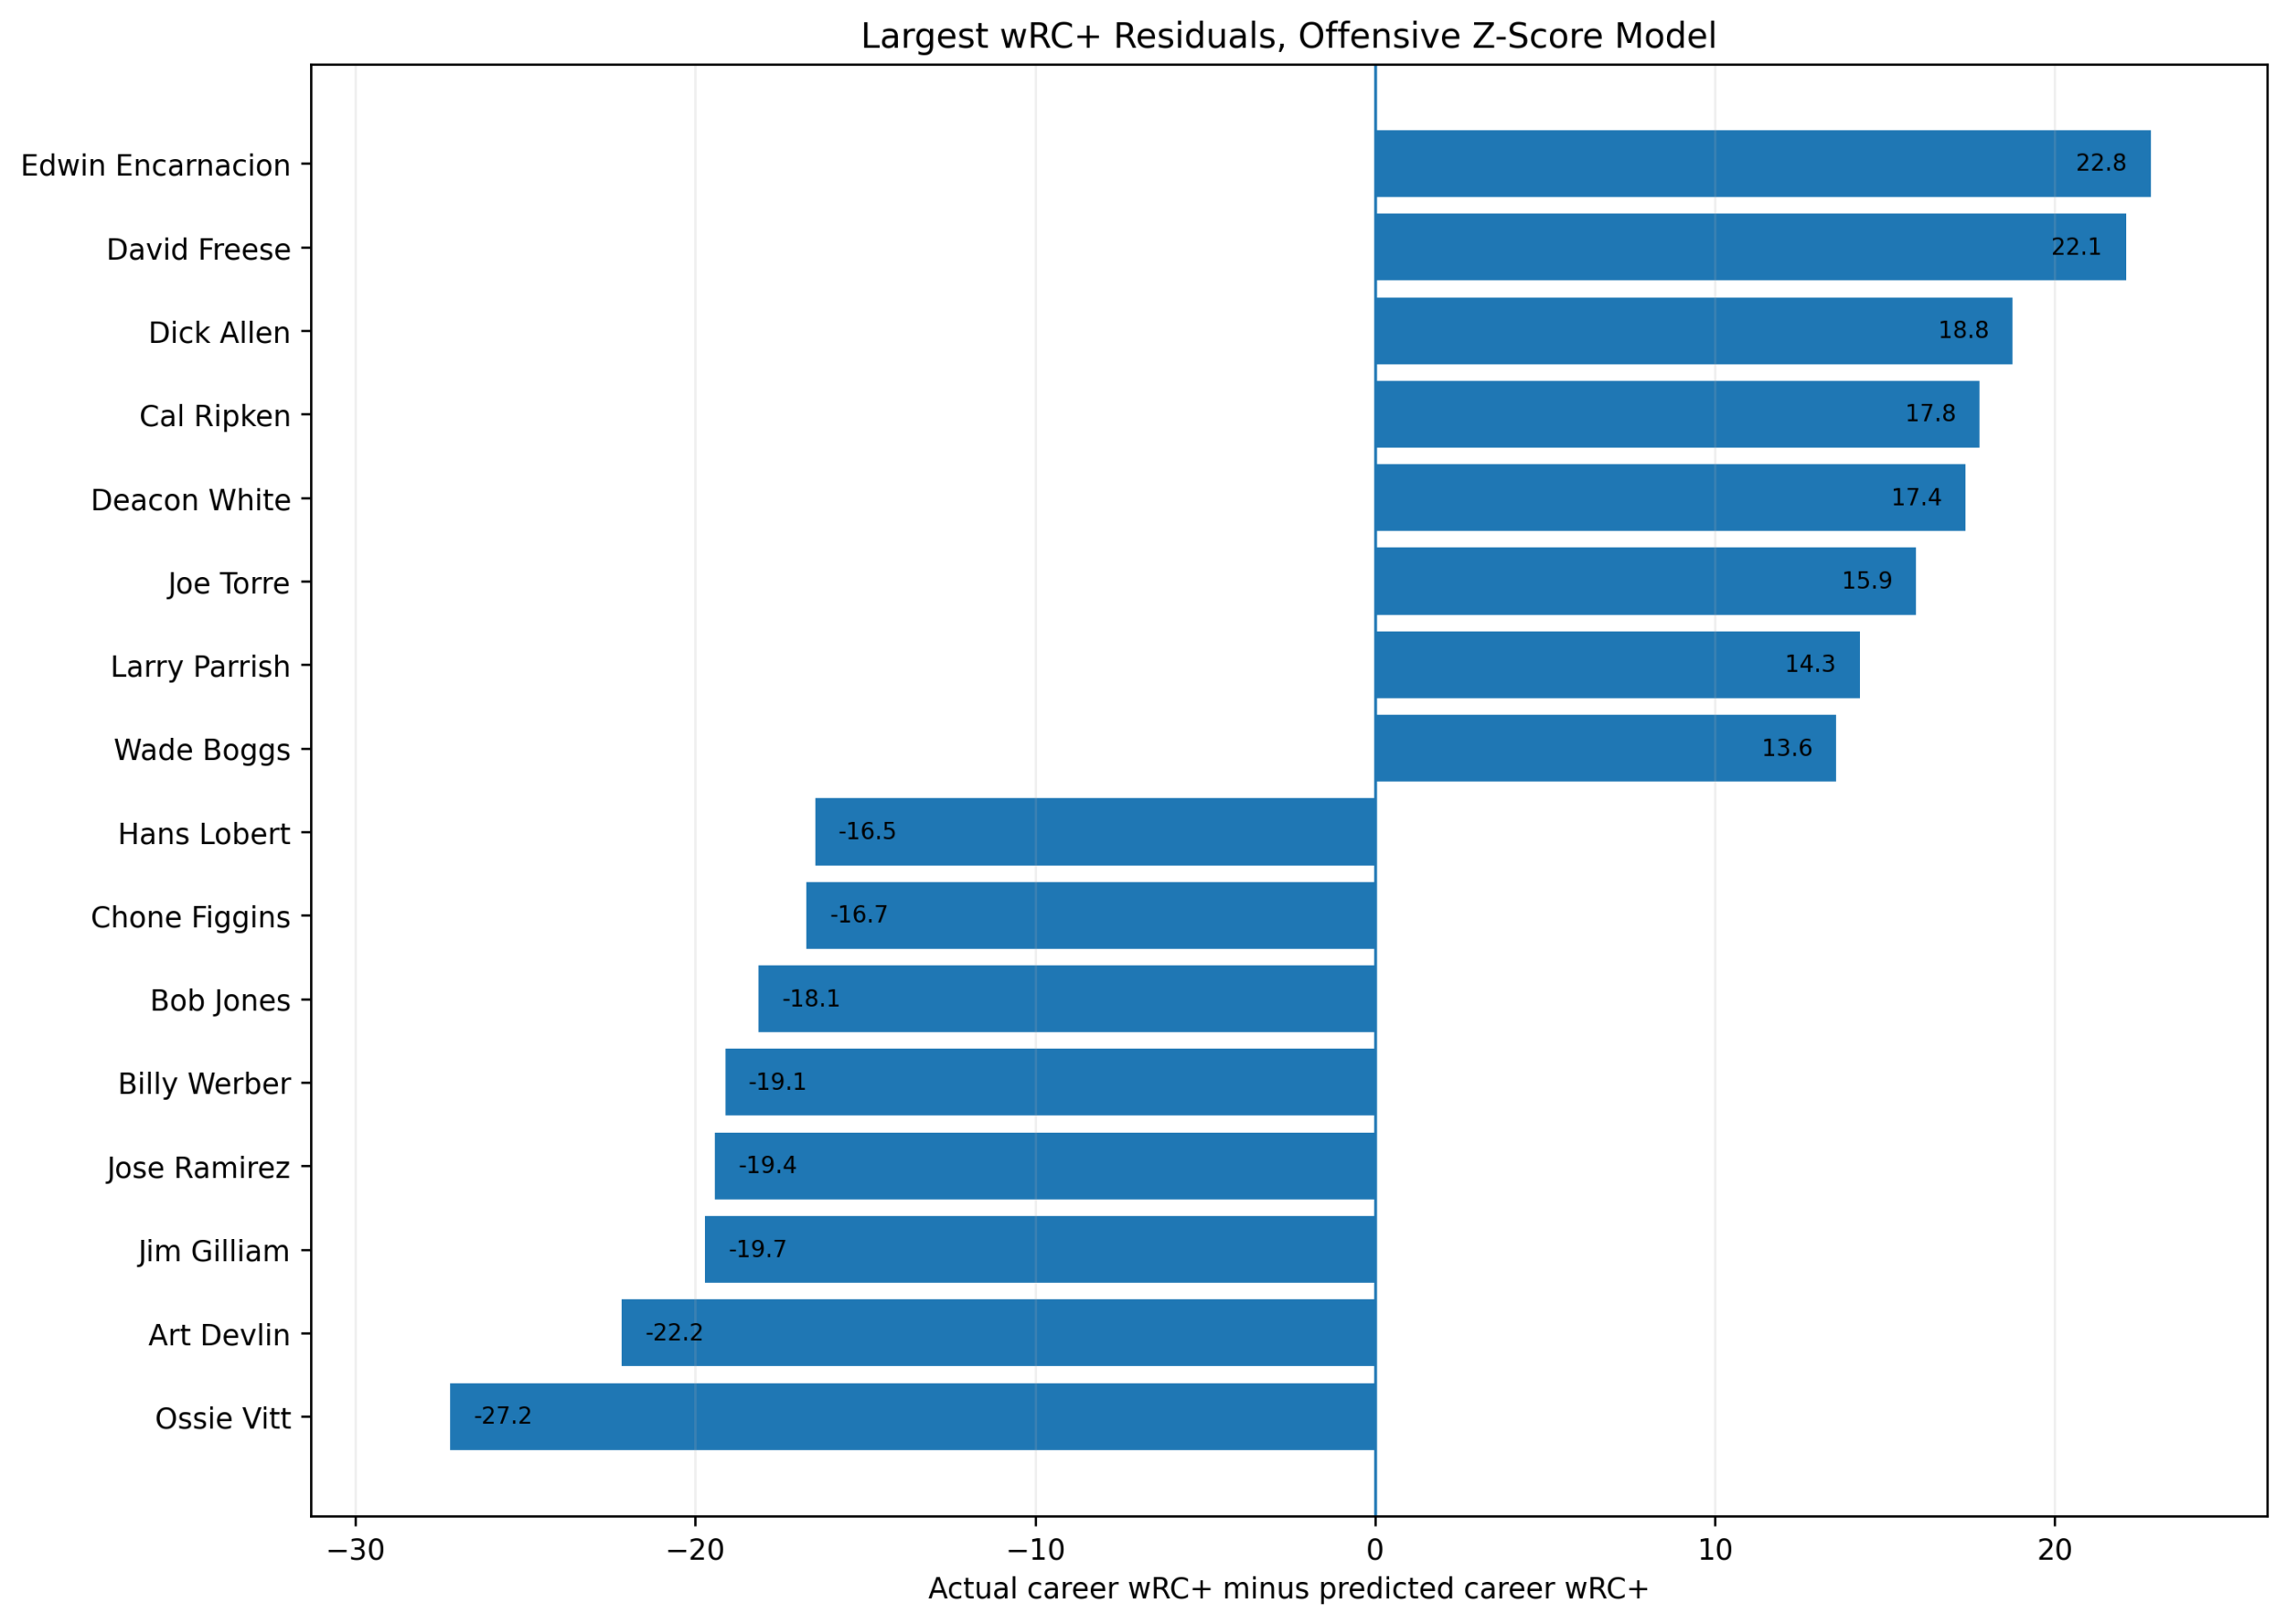
Figure 5. Largest wRC+ residuals from the offensive z-score model.
The residual equation is:
\text{Residual}_i = wRC^+_i - \widehat{wRC^+}_iPositive residuals mean the player’s FanGraphs wRC+ is higher than the z-score model predicts.
Negative residuals mean the player’s FanGraphs wRC+ is lower than the z-score model predicts.
The largest positive residuals include:
Edwin Encarnacion
David Freese
Dick Allen
Cal Ripken Jr.
Deacon White
Joe Torre
Larry Parrish
Wade Boggs
These players had higher wRC+ values than the offensive z-score model predicted.
The largest negative residuals include:
Ossie Vitt
Art Devlin
Jim Gilliam
Jose Ramirez
Billy Werber
Bob Jones
Chone Figgins
Hans Lobert
These players had lower wRC+ values than the model predicted.
The residuals are not merely mistakes. They show where the two systems differ.
Interpreting the Positive Residuals
Positive residuals are especially interesting because they identify players whose wRC+ is better than our average offensive z-score model expects.
For example, Edwin Encarnacion has a large positive residual. His career wRC+ is much stronger than his average third-base z-score profile suggests. This may reflect the fact that much of his offensive identity was formed outside a long traditional third-base career. Since our model focuses on qualified third-base seasons, while FanGraphs career wRC+ reflects his broader batting career, the comparison can produce differences.
David Freese also appears as a positive residual. His wRC+ is higher than expected from the third-base z-score model.
Dick Allen is another important case. He had enormous offensive quality, and his wRC+ remains higher than the model predicts, even though the model already rates him strongly.
Wade Boggs is also above prediction. That may reflect the way wRC+ values his on-base skill and batting quality more directly than a model that also includes runs, RBI, power, and baserunning components.
Interpreting the Negative Residuals
Negative residuals tell the opposite story.
Ossie Vitt is much lower in wRC+ than the offensive z-score model predicts. Art Devlin, Jim Gilliam, Jose Ramirez, Billy Werber, Bob Jones, Chone Figgins, and Hans Lobert also fall below prediction.
These cases require careful interpretation.
Some players may be rewarded in our Model C framework because they separated from their third-base peers in components that do not translate as strongly into wRC+. Runs, RBI, stolen-base value, and contact profile can influence the z-score model differently than wRC+.
Jose Ramirez is especially interesting. The model predicts a higher wRC+ than his current FanGraphs career mark. That may reflect his strong same-position separation across multiple components, including power, walks, baserunning, runs, and RBI. It may also reflect the fact that his career is still active.
A negative residual does not mean the z-score model is wrong. It means the z-score model and wRC+ are measuring offense from different angles.
That difference is analytically useful.
What the wRC+ Validation Shows
The wRC+ validation supports the offensive model in three ways.
First, the relationship is strong:
R^2 = 0.740Second, the slope is meaningful:
\beta_1 = 5.41That means each additional average offensive z-score point corresponds to about 5.41 points of wRC+.
Third, the negative-control test works:
R^2_{\text{Defense Only}} = 0.022Traditional defense does not predict wRC+.
That is exactly what should happen if the model is behaving properly.
Why This Complements the WAR Validation
The WAR validation and wRC+ validation answer different questions.
The WAR validation asked:
Do offense and traditional defense together predict total value?
The answer was yes.
The career-level offense-plus-defense model for regular third basemen had:
R^2 = 0.814The wRC+ validation asks:
Does the offensive z-score model predict offensive quality?
The answer is also yes.
The average offensive score model has:
R^2 = 0.740Together, these two validation studies are stronger than either one alone.
WAR validates the broader two-dimensional structure.
wRC+ validates the offensive dimension specifically.
The negative control confirms that the defensive dimension is not pretending to be offense.
This gives the project a stronger methodological foundation.
What the Study Does Not Prove
This chapter should not be overread.
It does not prove that Model C is better than wRC+. It does not prove that wRC+ is perfect. It does not prove that every residual is meaningful. It does not prove that the z-score model captures park effects, full run values, league quality, or all contextual differences.
The FanGraphs file used here is at the career level. That means this chapter does not yet test season-by-season wRC+ against season-by-season z-scores.
A season-level wRC+ study would be even cleaner because it would compare:
\text{Season Offensive Z-Score}directly against:
\text{Season } wRC^+That should be the next step if we obtain a season-level FanGraphs export.
For now, this chapter provides strong career-level validation.
Conclusion
The wRC+ validation study answers a direct question:
Do third-base offensive z-scores predict an established offensive metric?
Yes.
Among third-base regulars, the average Model C offensive score per qualified season strongly predicts FanGraphs career wRC+:
wRC^+ = 100.89 + 5.41(\text{Average Offensive Score}) R^2 = 0.740The cumulative offensive score also predicts wRC+, but less strongly:
R^2 = 0.661Traditional defense does not meaningfully predict wRC+:
R^2 = 0.022That is exactly the pattern we wanted.
The offensive model predicts offense.
The defensive model does not.
The combined validation framework now has both breadth and specificity.
The WAR study showed that offense plus defense predicts total value.
The wRC+ study shows that the offensive z-score model predicts offensive quality.
That is a major validation result for the third-base project.
![]()