The original third-base study produced a clean and stunning result.
Mike Schmidt was the offensive winner.
Using Model A, which emphasized OBP, SLG, HR/PA, BB/PA, R/PA, and RBI/PA, Schmidt separated clearly from the rest of the field. Eddie Mathews, Chipper Jones, Ron Santo, Home Run Baker, Alex Rodriguez, and others formed the next group, but Schmidt stood alone at the top.
That result made intuitive sense. Schmidt’s combination of power, walks, run production, and long career fit the Model A framework almost perfectly.
But Model A was only one way to define offensive dominance.
It rewarded power and run production heavily. It also included some overlap because SLG and HR/PA both capture parts of the power profile. That does not make the model suspect; it just means the model has a particular shape.
So the next step was a Sensitivity Test.
What happens if we broaden the definition of “offensive”?
That is the purpose of Model C. Yes, there was a Model B, but it was deemed too similar to the initial model (Model A) and was scrubbed.
The Model C Framework
Model C keeps the basic structure of the original study. A third baseman is still compared only to other third basemen in the same season. The qualification rules are unchanged:
At least 50 games at third base
At least 300 plate appearances
Same-year third-base peer group
The difference is in the offensive categories.
Model C uses:
OBP
ISO
BB/PA
SO/PA, inverted
Net SB/PA
R/PA
RBI/PA
This changes the question.
Model A asked: who dominated through on-base ability, slugging, home-run rate, walks, runs, and RBI?
Model C asks something broader: who combined on-base skill, isolated power, plate discipline, contact, baserunning value, and run production?
The key change is that Model C replaces SLG and HR/PA with ISO, adds strikeout avoidance, and adds net stolen-base value. A lower strikeout rate is considered better. Net stolen bases are calculated as stolen bases minus caught stealing, scaled by plate appearances.
This is still not a complete offensive-value model. It does not calculate linear weights or wRC+. But it is broader than Model A and less redundant in its treatment of power.
Figure 1: Model C Career Offensive Dominance
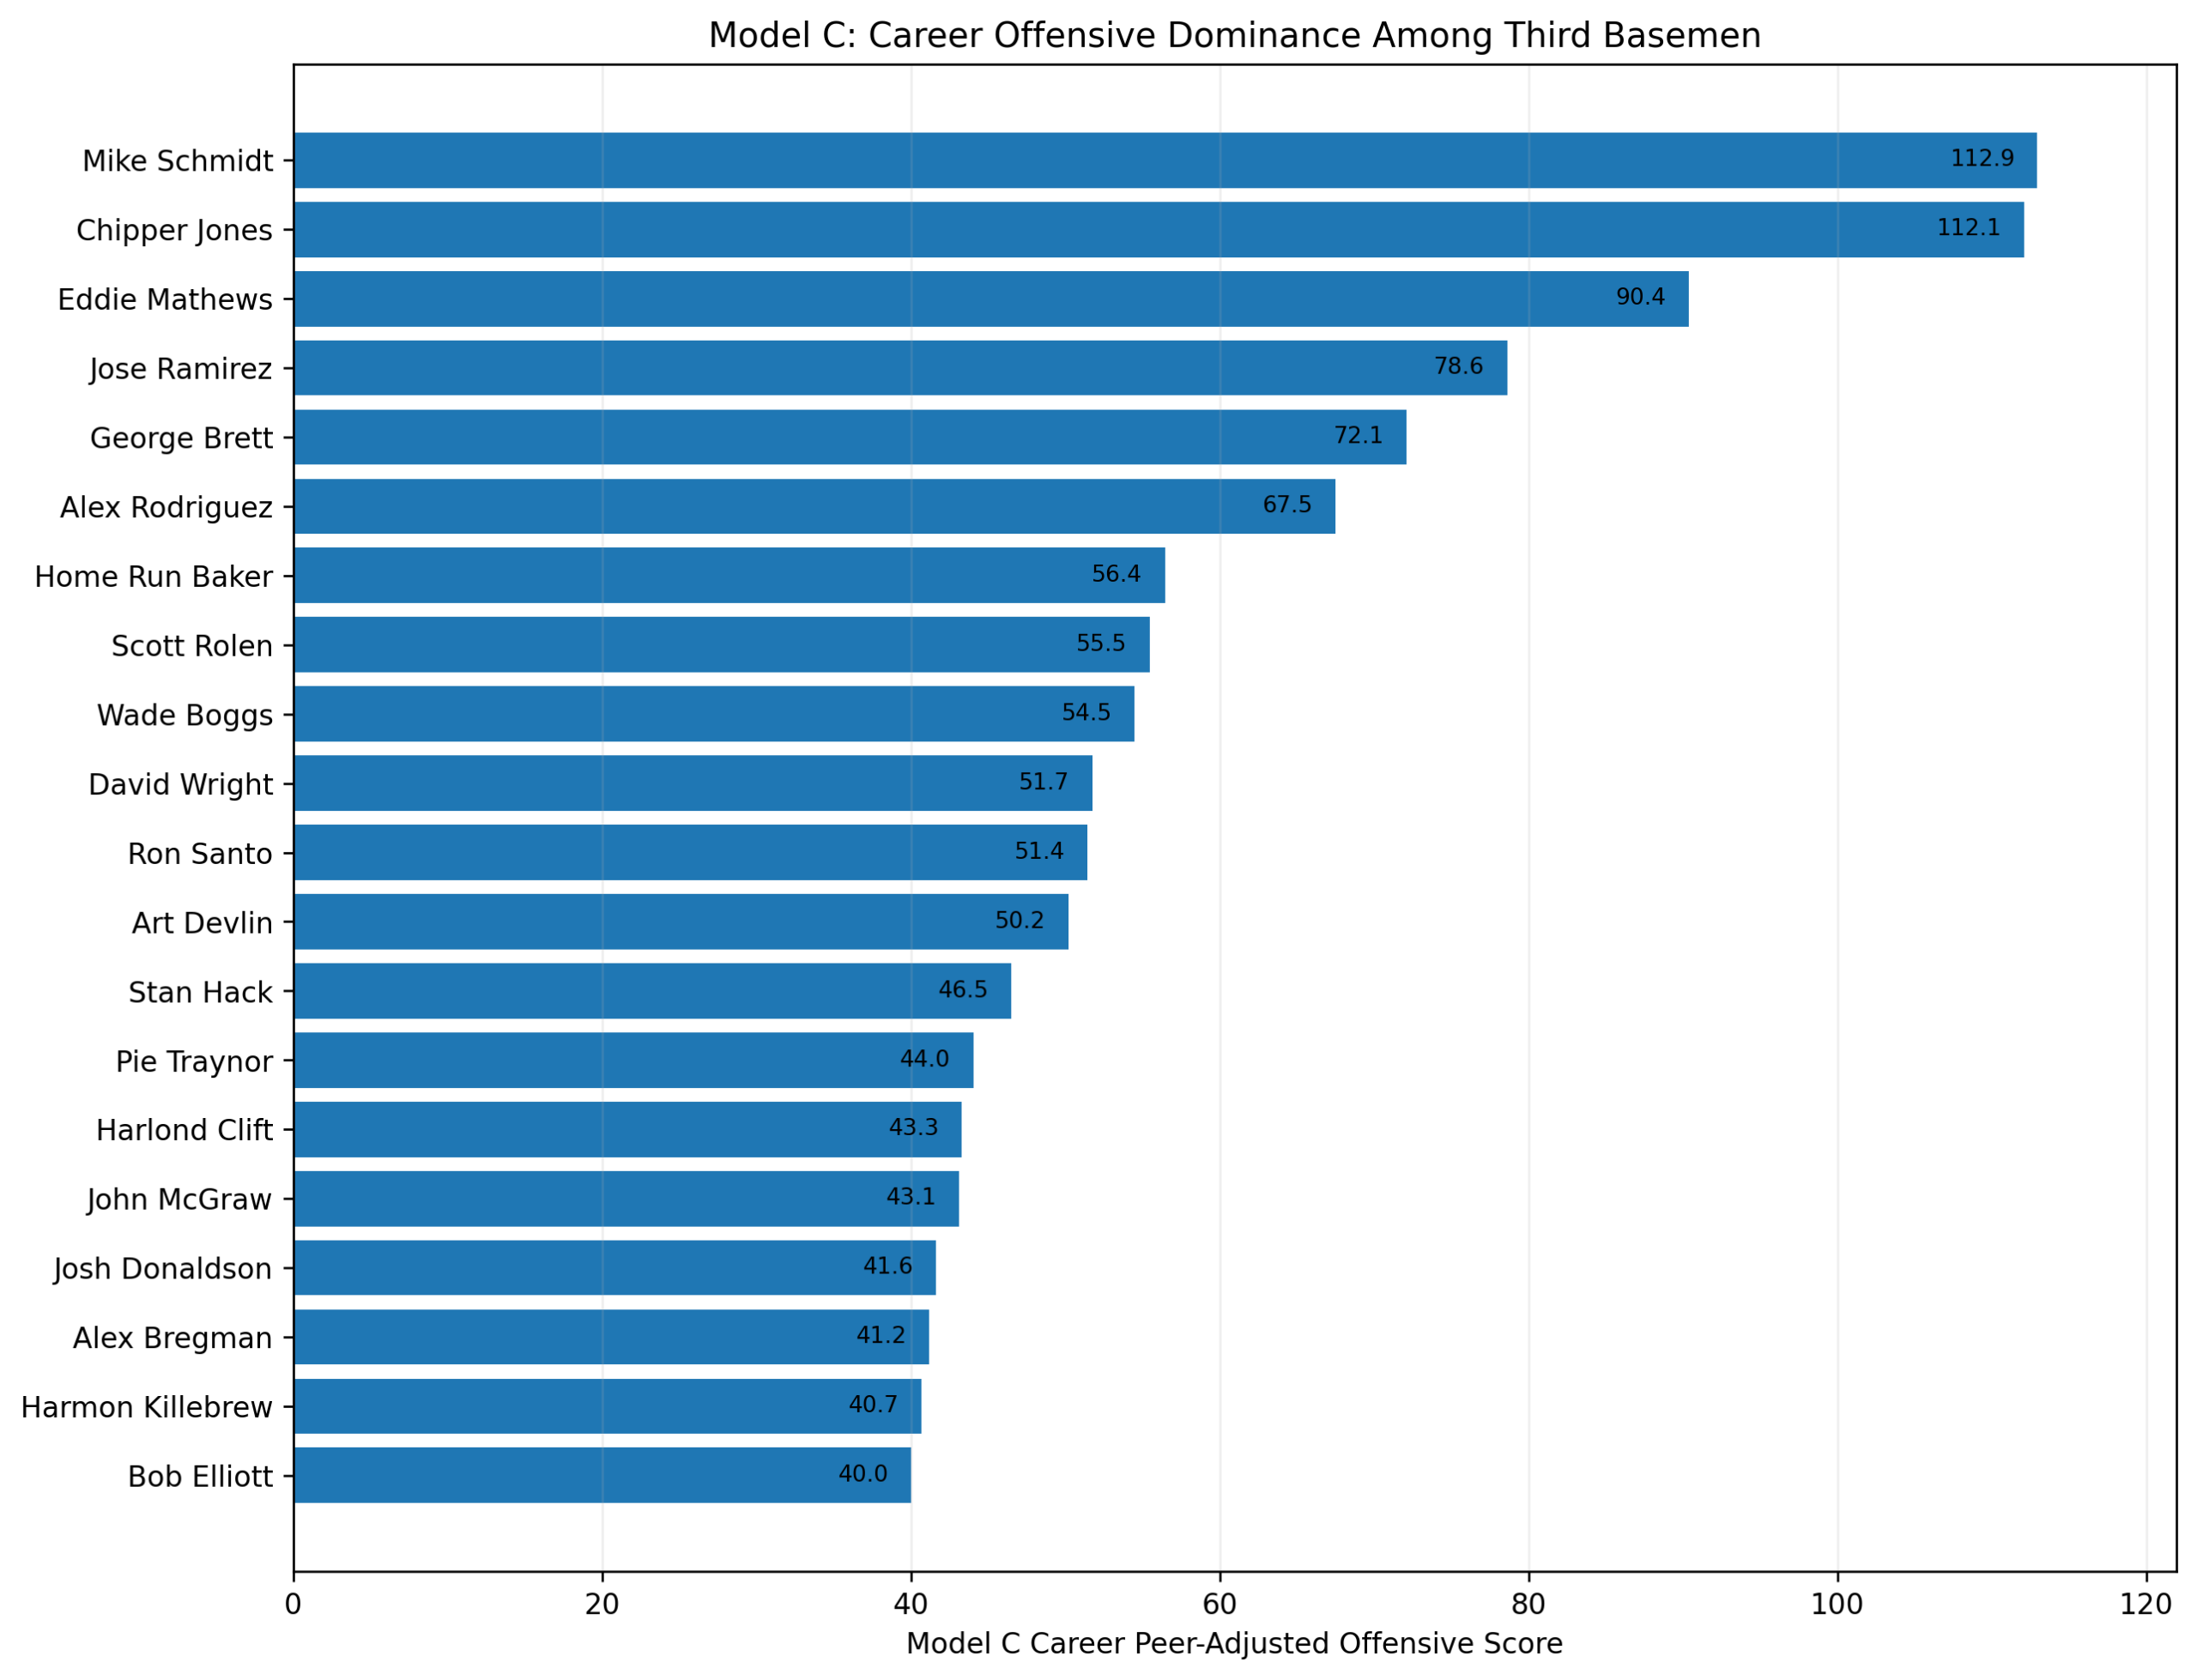
The headline result is simple:
Mike Schmidt still wins.
But the margin is dramatically smaller.
Schmidt finishes first with a Model C career score of 112.9. Chipper Jones is almost even at 112.1. That is not a landslide. That is essentially a photo finish.
The top five:
| Rank | Player | Career Score |
| 1 | Mike Schmidt | 112.9 |
| 2 | Chipper Jones | 112.1 |
| 3 | Eddie Mathews | 90.4 |
| 4 | Jose Ramirez | 78.6 |
| 5 | George Brett | 72.1 |
This is a major shift in the argument’s structure.
Schmidt remains the career winner, but Chipper Jones becomes a much stronger challenger. That makes sense. Chipper’s game was better suited to Model C. He retained his on-base and walk advantages, but he benefited from better contact and a more rounded offensive profile.
Schmidt, meanwhile, remained powerful and patient, but Model C penalized his strikeout rate. He still wins because his positives are enormous. But the broader model narrows the gap.
Eddie Mathews remains third, which is important. He was not just a Model A power beneficiary. His overall offensive separation still survives the broader test.
Then comes the biggest modern movement: Jose Ramirez.
Jose Ramirez Changes the Peak Argument
Jose Ramirez ranks fourth in career score, but that understates what Model C does for him. His career is still ongoing, and the model is already placing him among the most important offensive third basemen in the study.
The reason is straightforward. Ramirez is not just a slugger. He brings power, plate discipline, low strikeouts, baserunning value, runs, and RBI. Model C rewards that broader offensive footprint.
That becomes even clearer in the peak chart.
Figure 2: Model C Seven-Season Peaks
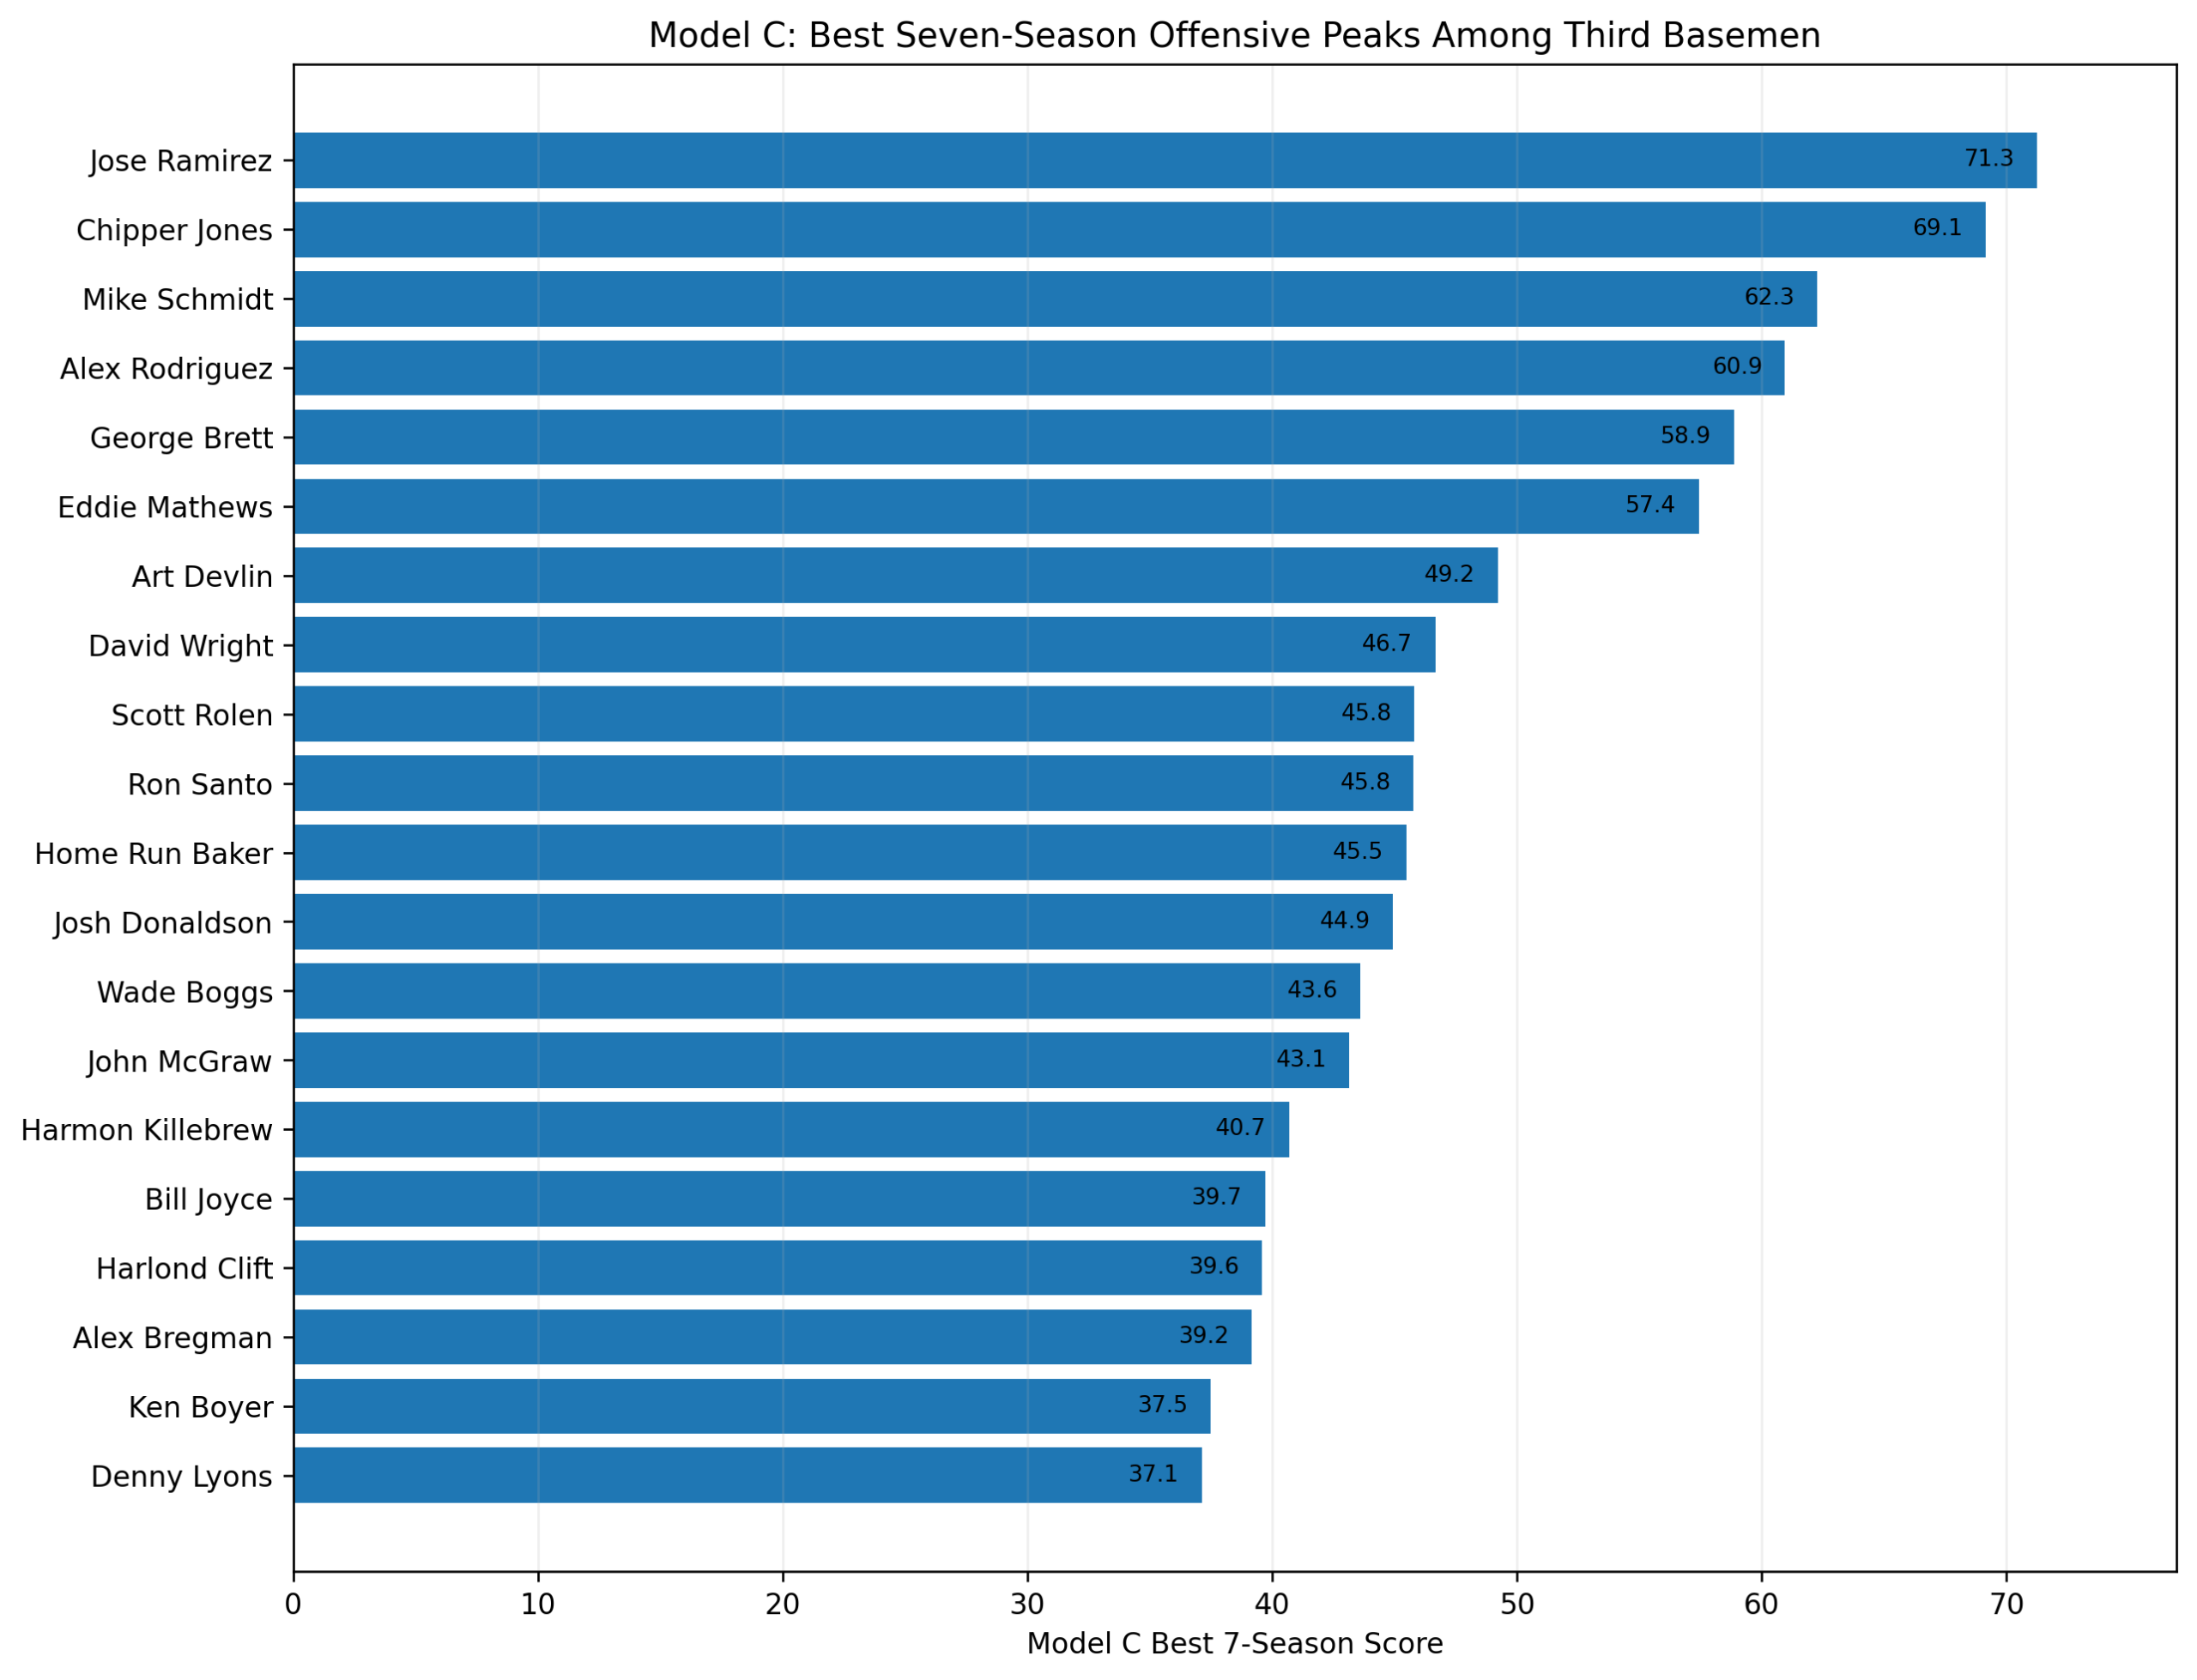
This may be the most important figure in the Model C third-base study.
Jose Ramirez has the highest seven-season peak score among third basemen:
| Rank | Player | Peak 7 Score |
| 1 | Jose Ramirez | 71.3 |
| 2 | Chipper Jones | 69.1 |
| 3 | Mike Schmidt | 62.3 |
| 4 | Alex Rodriguez | 60.9 |
| 5 | George Brett | 58.9 |
| 6 | Eddie Mathews | 57.4 |
That is a very different story from Model A.
Under the original framework, Schmidt was the clean career and power-dominance winner. Under Model C, Ramirez becomes the peak leader. Chipper Jones becomes the balanced-score leader. Schmidt remains the career-score leader.
So third base no longer has one simple answer.
It has three answers, depending on what we are asking:
Career Score: Mike Schmidt
Peak 7 Score: Jose Ramirez
Balanced Score: Chipper Jones
That does not overturn Schmidt’s case. It refines it.
Schmidt is still the long-career offensive dominance winner. But Model C shows that the broader-skill version of the third-base argument is much more open than Model A suggested.
Figure 3: Who Moved Most From Model A to Model C?
![]()
The rank-change figure shows how different the models are.
Some players rise sharply because Model C rewards contact, baserunning, and broad offensive production. Others fall because Model A rewarded power and run production more directly.
The most meaningful risers near the top of the list are:
Jose Ramirez
Wade Boggs
David Wright
George Brett
Scott Rolen
Chipper Jones
Jose Ramirez moves from 18th in Model A to 4th in Model C.
Wade Boggs moves from 31st to 9th.
David Wright moves from 21st to 10th.
Those changes are not random. They reveal what Model C values.
Boggs, for example, was never going to thrive in a model strongly shaped by home-run rate and slugging. But once OBP, contact, and broader offensive profile become more important, he rises dramatically.
Ramirez rises because he is almost the perfect Model C player: power, speed, low strikeouts, net stolen-base value, and run production.
Chipper Jones rises because his offensive profile is more balanced than Schmidt’s. He does not overwhelm the model with one trait. He scores well across many of them.
Some power-heavy players fall. That is also expected. Model C does not ignore power, but it no longer lets power dominate the same way.
Figure 4: Career Versus Peak
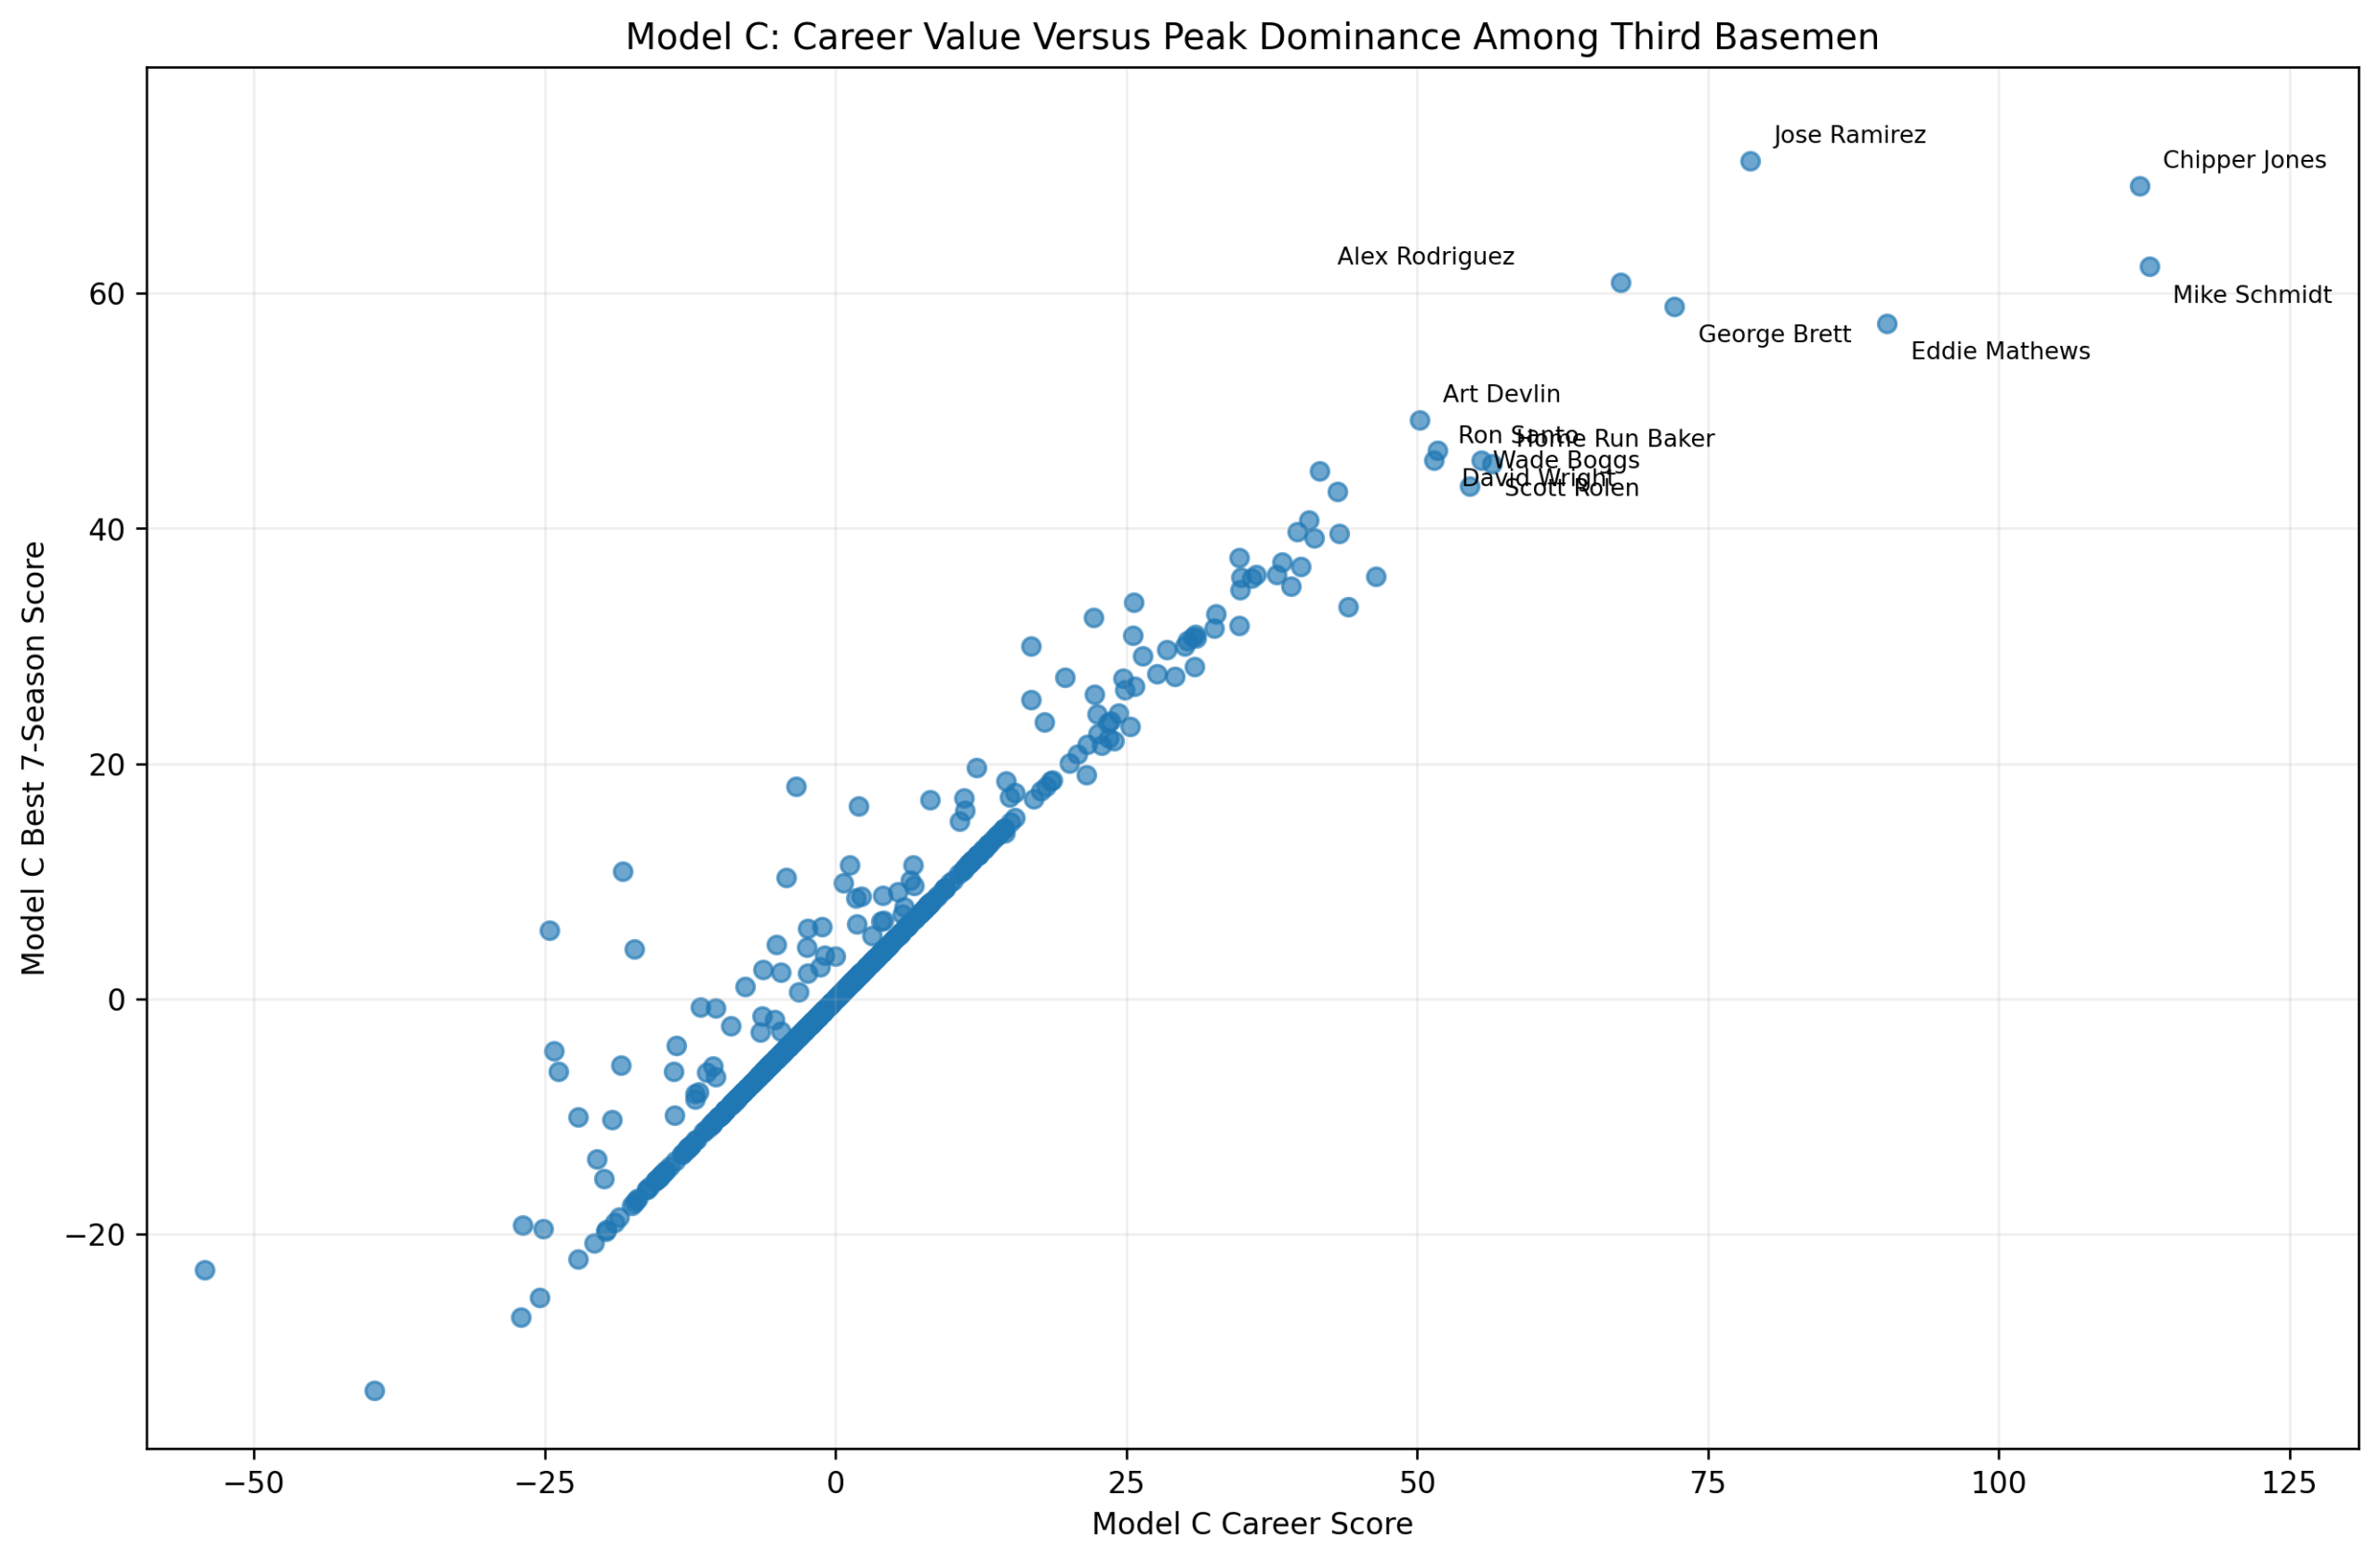
The career-versus-peak scatterplot shows the new shape of third-base greatness.
Schmidt and Chipper Jones sit farthest to the right. They are the two great career cases. But Chipper is higher on the y-axis, meaning he has the better seven-season peak under Model C.
Jose Ramirez sits above both of them in peak value, though not as far right in career value. That is exactly what we would expect from an active player with a concentrated run of broad-skill excellence.
Eddie Mathews remains strong on both axes. Alex Rodriguez is also high on peak, though his third-base career is shorter than Schmidt’s, Chipper’s, or Mathews’s.
George Brett sits in an interesting middle space. He does not quite match Schmidt or Chipper in career score, but Model C treats him more favorably than Model A because his profile includes batting average, contact, OBP, and run production.
The scatterplot makes the third-base debate more nuanced.
Schmidt is still the career answer.
Chipper is the balance answer.
Ramirez is the peak answer.
Mathews remains the great historical power anchor.
Brett becomes more visible in a broader offensive model.
That is exactly what a sensitivity test should do. It should not simply repeat the original result. It should show where the result is stable and where it depends on the definition.
Figure 5: Best Third-Base Seasons Under Model C
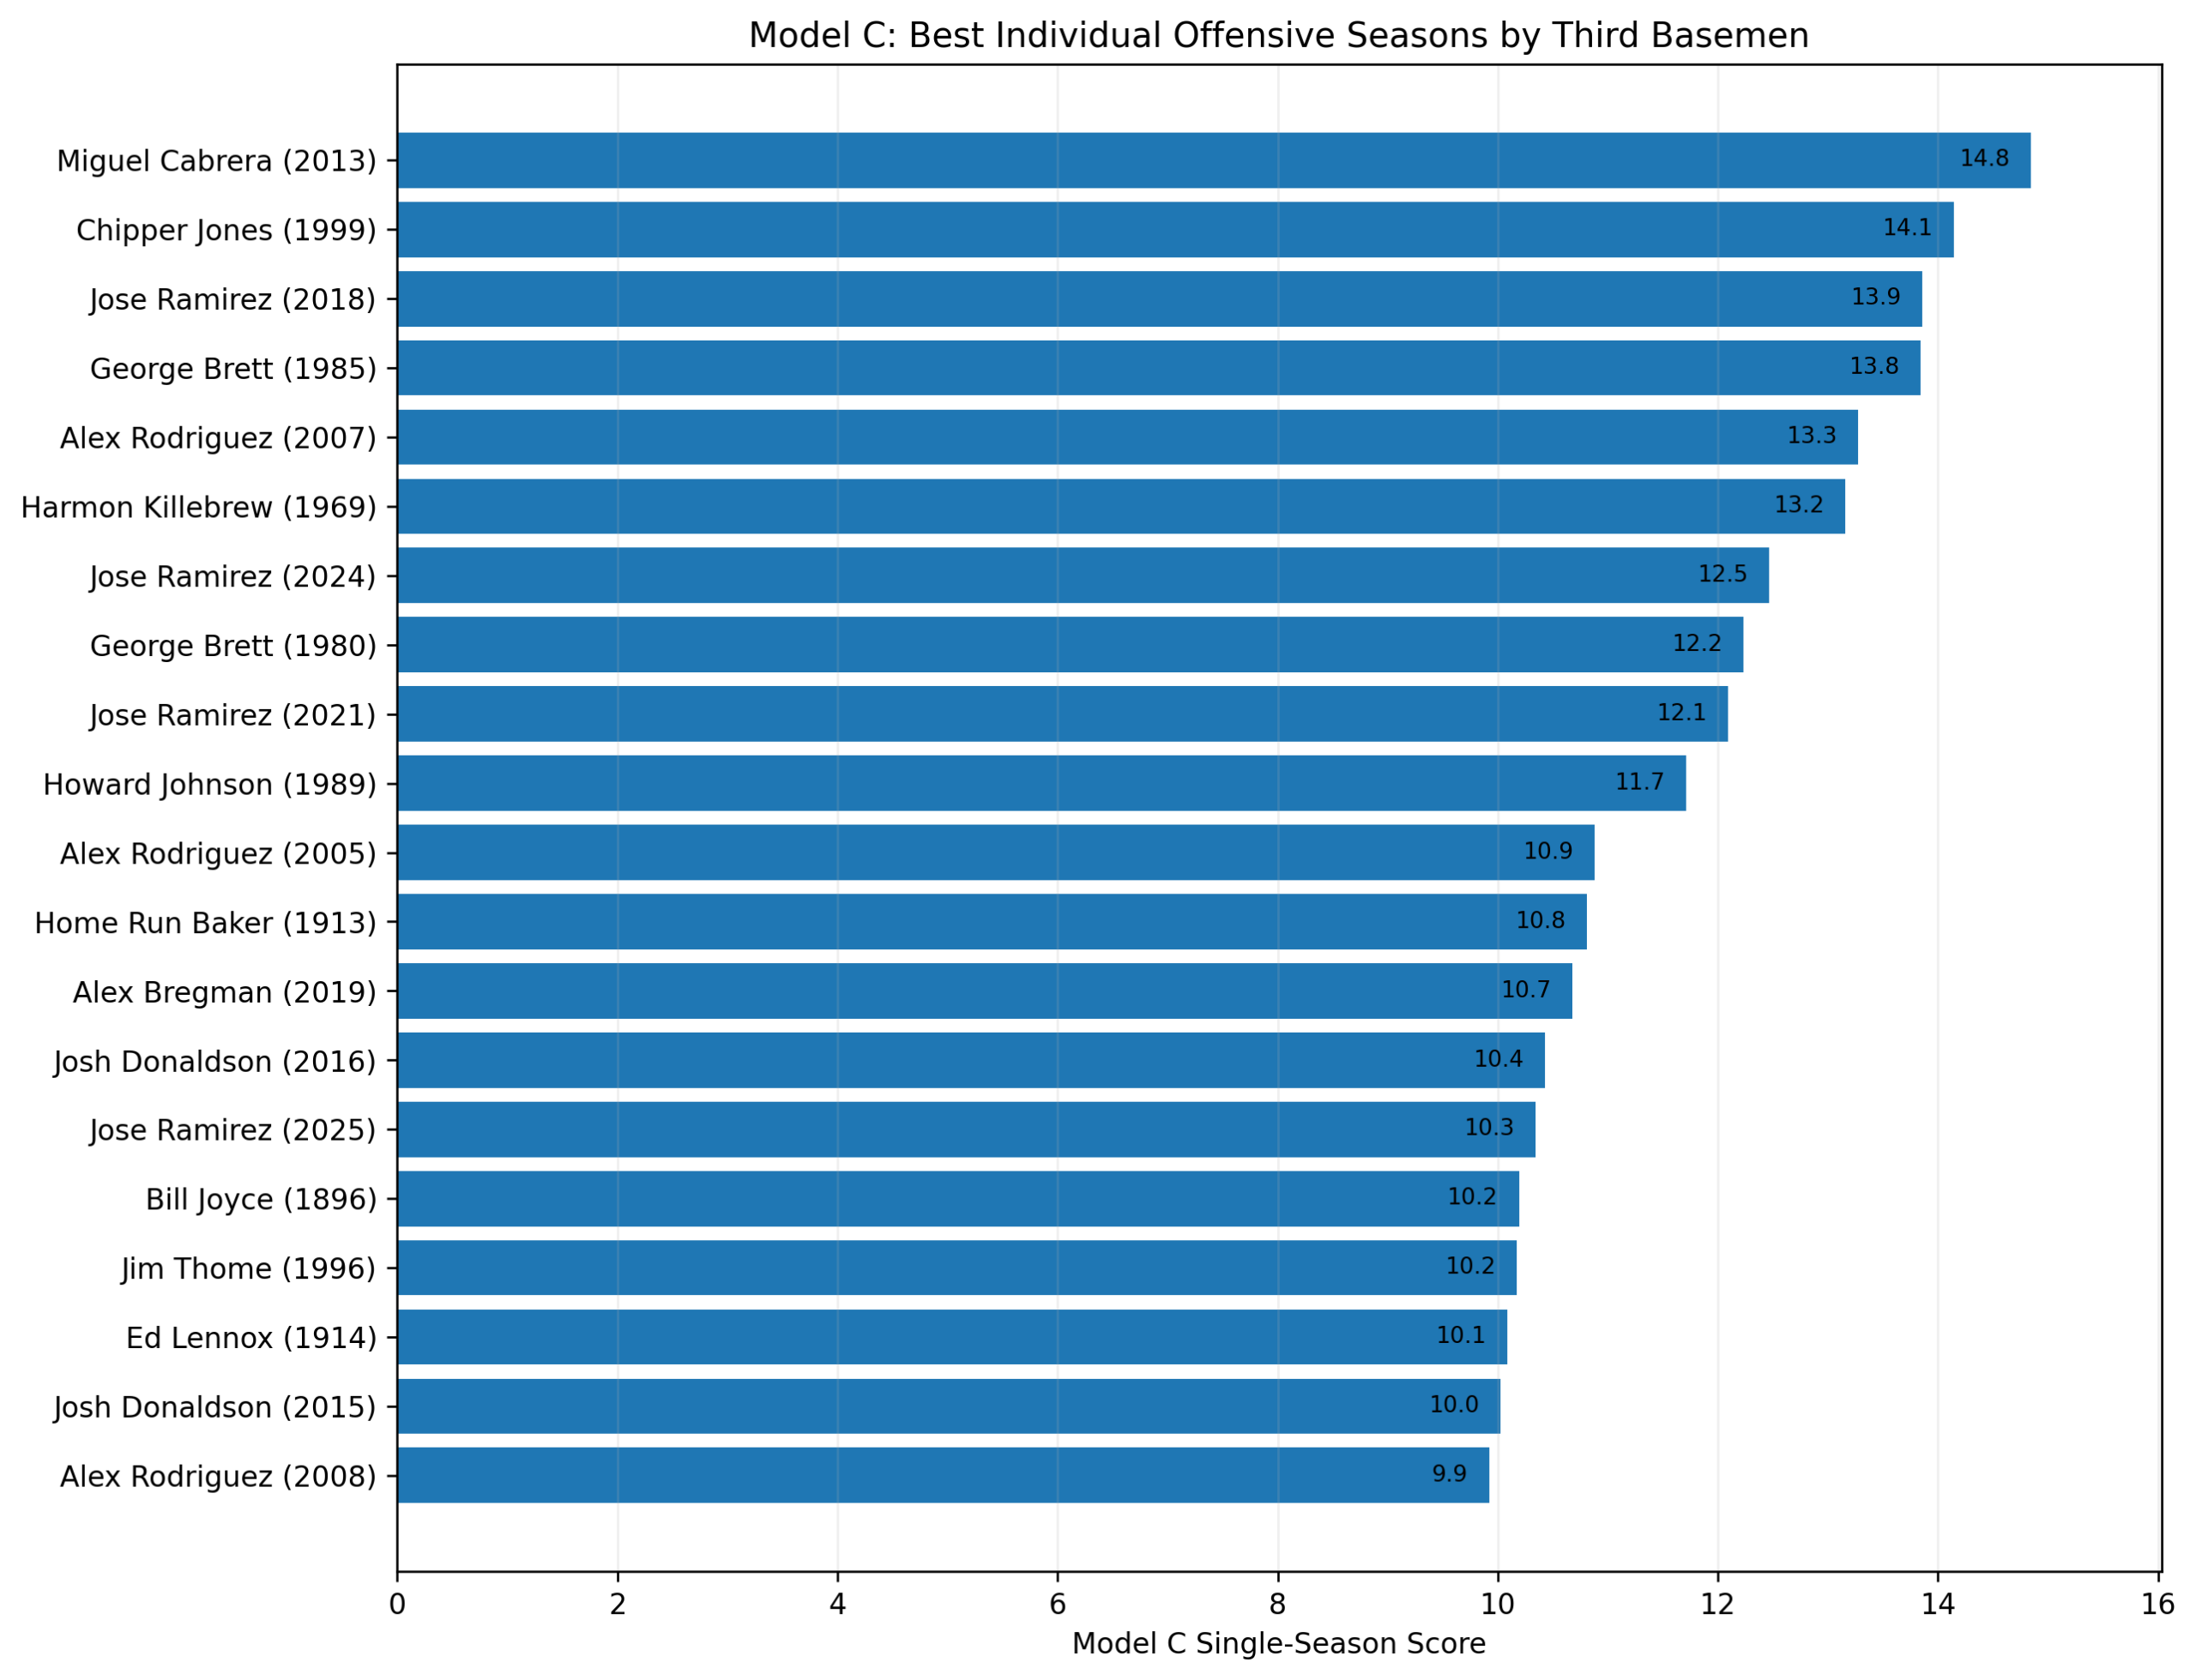
The single-season list also changes.
The top Model C third-base season is Miguel Cabrera in 2013, with a score of 14.8. That was already a huge season under Model A, and it remains enormous under Model C.
The top five:
| Rank | Player | Year | Score |
| 1 | Miguel Cabrera | 2013 | 14.8 |
| 2 | Chipper Jones | 1999 | 14.1 |
| 3 | Jose Ramirez | 2018 | 13.9 |
| 4 | George Brett | 1985 | 13.8 |
| 5 | Alex Rodriguez | 2007 | 13.3 |
This list is revealing.
Cabrera’s 2013 season survives because it was not merely a power season. It combined elite OBP, strong ISO, run production, and enough overall separation to remain first.
Chipper’s 1999 season ranks second. That fits the broader Model C story. Chipper’s peak was not a statistical illusion. It was a complete offensive peak.
Jose Ramirez’s 2018 season ranks third, and he also places several other seasons on the list. That reinforces his new status as a major Model C figure.
George Brett’s 1985 and 1980 seasons also appear high. Brett benefits from the broader model because it recognizes contact, OBP, low strikeouts, and run production.
Alex Rodriguez’s 2007 season remains high because the power and run production were overwhelming, even though Model C is less purely power-driven than Model A.
Figure 6: Component Profiles
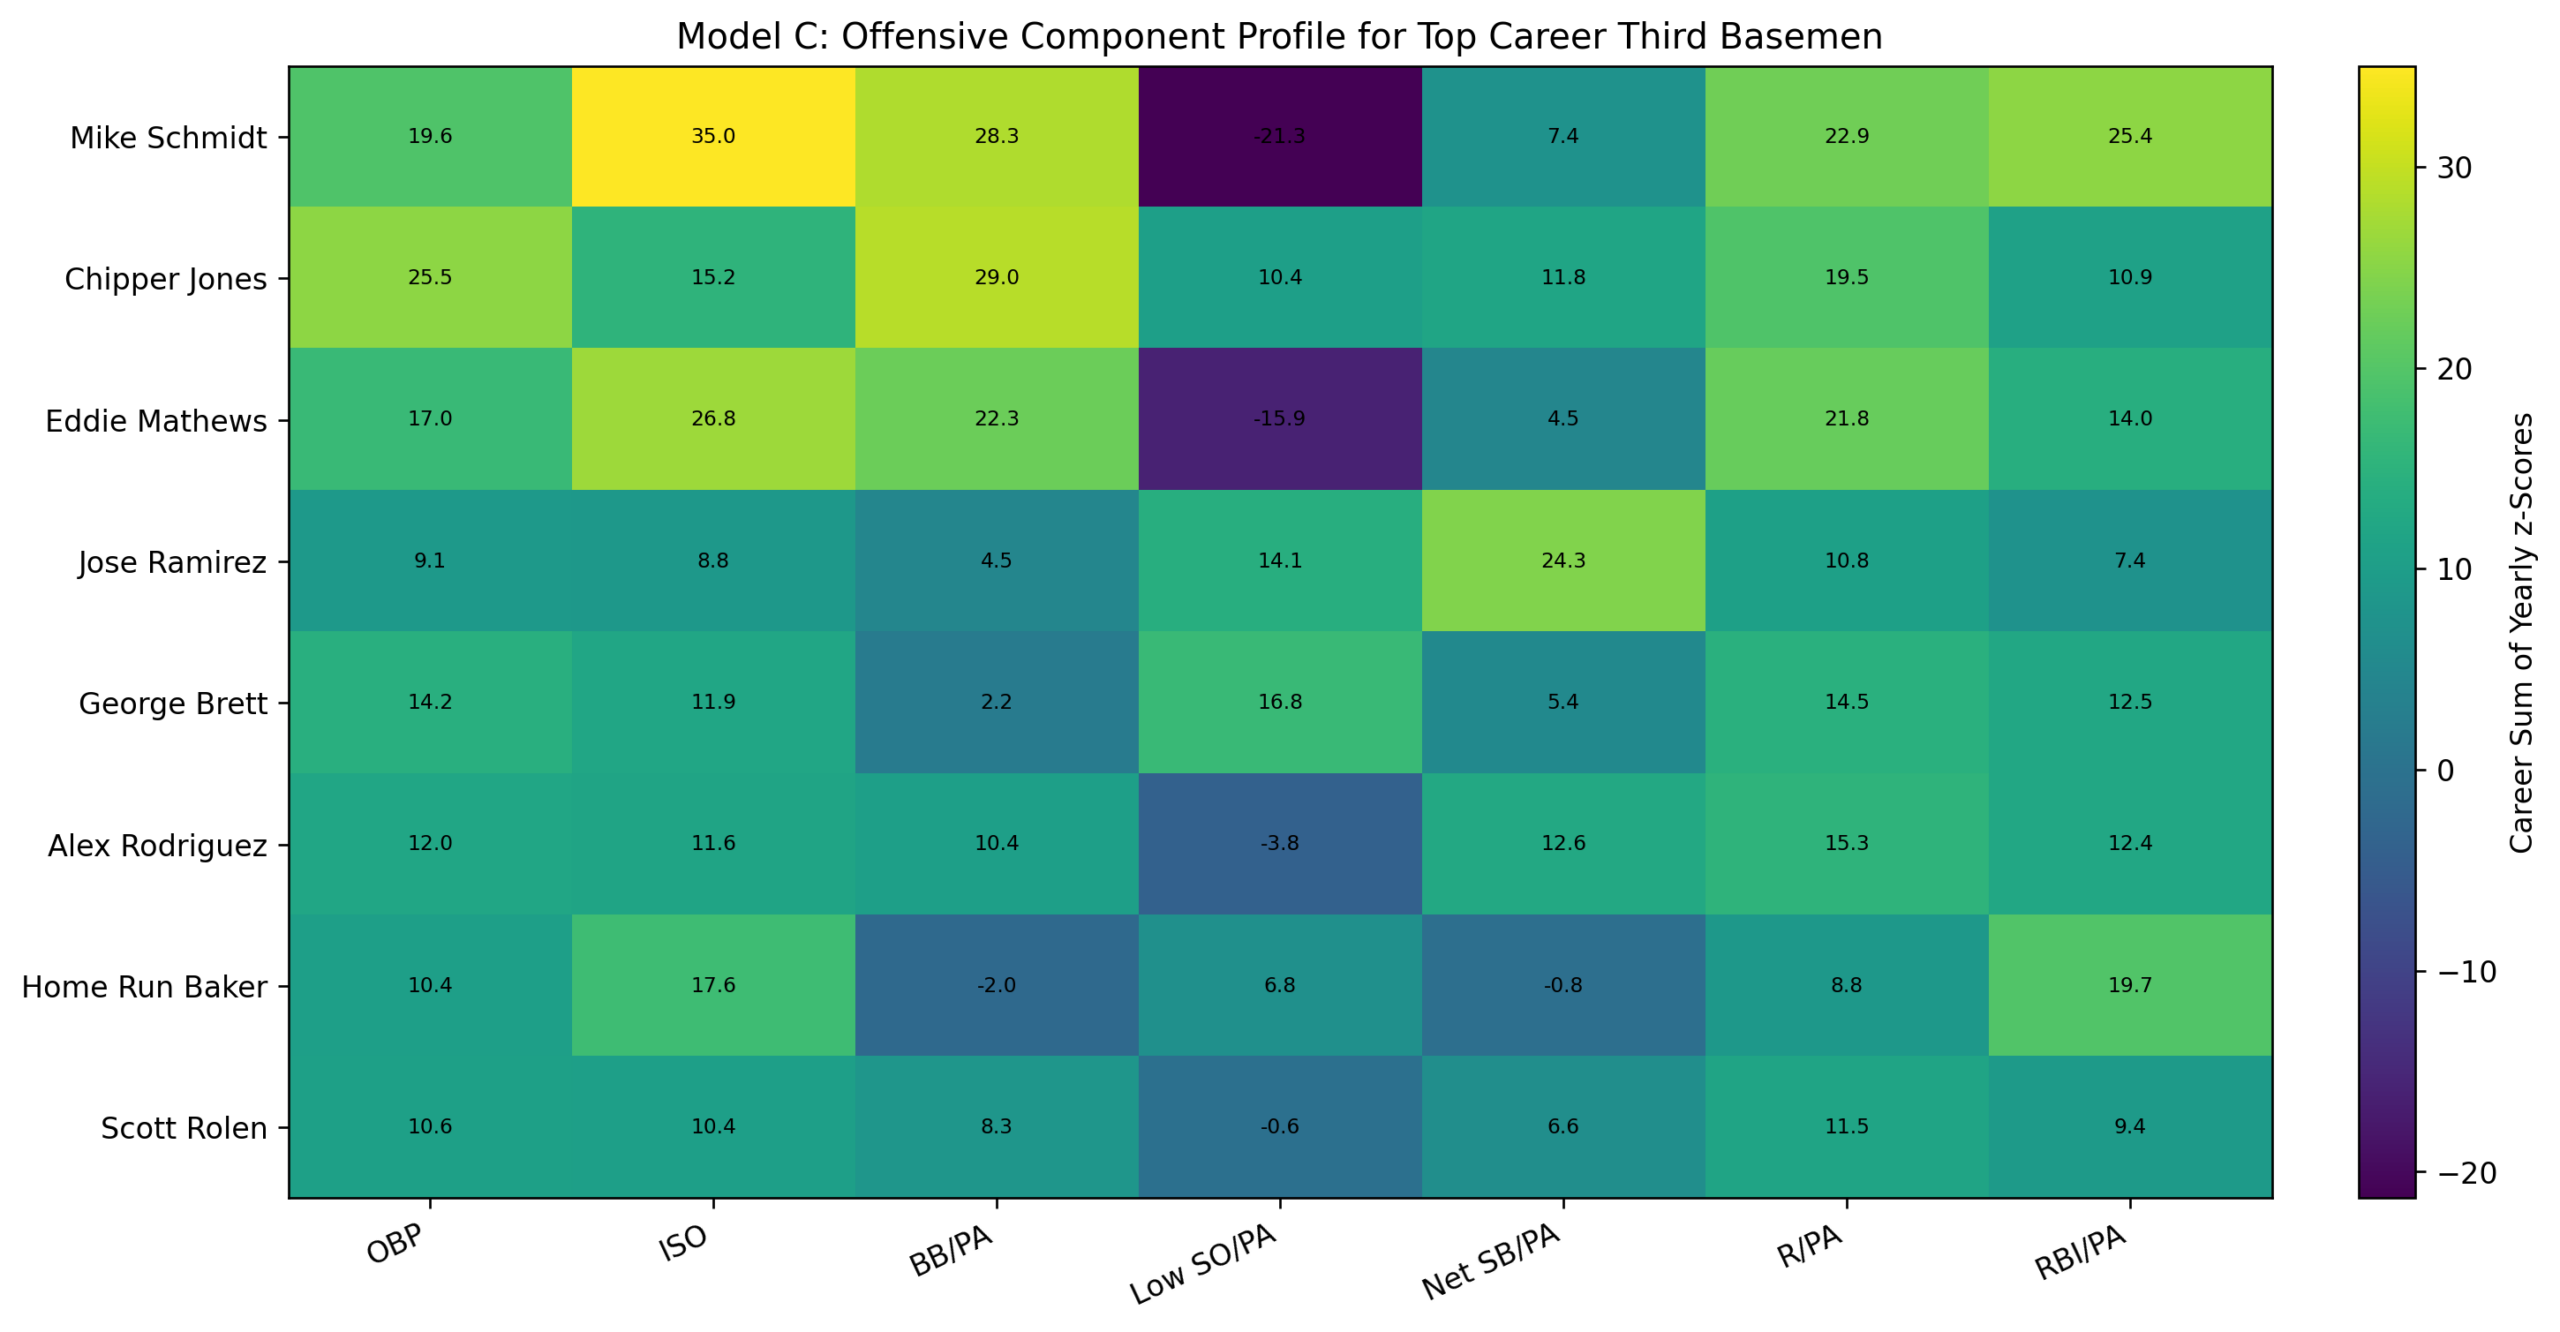
The component heat map explains why the rankings changed.
Schmidt’s profile is obvious: huge ISO, walks, runs, and RBI. But he takes a major hit in the low-strikeout category. That is the price of his profile in Model C.
Chipper Jones is more balanced. He scores well in OBP, walks, contact, net steals, and run production. His ISO is not Schmidt-level, but he has fewer weaknesses across the model.
Jose Ramirez has a very different shape. His net stolen-base value is exceptional, and his low-strikeout profile helps him substantially. He is not as dominant as Schmidt in isolated power or walks, but he gains value from being good everywhere.
George Brett also benefits from the low-strikeout component. His profile looks less explosive than Schmidt’s, but more balanced.
Eddie Mathews remains powerful and patient, but like Schmidt, he is hurt by strikeouts.
This is the clearest explanation of the Model C result. The model is not saying Schmidt was worse than before. It says that once the definition of the offense widens, other players begin to catch up.
What Changed From Model A?
Model A gave us a clean Schmidt result.
Model C yields a more complex third-base landscape.
The career winner is still Schmidt. That means the original conclusion was not fragile. Schmidt’s offensive dominance survives a broader model.
But the details change significantly.
Chipper Jones nearly catches Schmidt in career score and passes him in balanced score.
Jose Ramirez becomes the peak leader.
Wade Boggs, George Brett, David Wright, and other broader-skill players rise.
Some power-heavy profiles lose ground.
This is exactly what we should expect. Model C rewards a different offensive ecology.
It asks not only who hit for power and drove in runs, but who combined many offensive skills at once.
The New Third-Base Conclusion
After Model C, I would revise the third-base conclusion this way:
Mike Schmidt remains the best career offensive third baseman in the study.
That is still true.
But it is no longer the whole story.
Chipper Jones now has the strongest balanced argument. His career score is almost identical to Schmidt’s, and his seven-season peak is higher.
Jose Ramirez has the strongest argument for the Model C peak. That is a major finding and one that deserves attention, especially because his career is still active.
Eddie Mathews remains the great historical power challenger.
George Brett, Wade Boggs, and David Wright look better when the model rewards broader offensive skill.
The result is not a contradiction of Model A. It is an enrichment of it.
Model A showed Schmidt’s dominance in power and patience.
Model C shows that third base has a second story: the rise of complete offensive profiles.
Conclusion
The third-base sensitivity test worked exactly as it should.
It did not erase the original result. Schmidt still wins career score. That gives the original Model A conclusion credibility.
But it did change the argument.
The old story was:
Mike Schmidt is the clear offensive third-base winner.
The new story is:
Mike Schmidt is still the career winner, but Chipper Jones and Jose Ramirez become central once the model rewards broader offensive skills.
That is a better conclusion.
It is more nuanced. It is more honest. It shows how much a ranking depends on the offensive definition being used.
Schmidt’s case survives. But Model C reminds us that offensive greatness is not one thing. It can be power and patience. It can be contact and on-base skill. It can be speed and run creation. It can be a long career, a concentrated peak, or a balanced combination of both.
At third base, Model A gave us Schmidt.
Model C gives us Schmidt, Chipper, and Ramirez.
And that is not a problem for the study.
That is what makes the study more interesting.
![]()