Introduction
At this point in the third-base study, we have three different ways of measuring greatness.
The first is our own z-score framework. It asks how far a player separated from other third basemen in the same season and across a career.
The second is WAR. It asks how much total value a player produced, including offense, defense, baserunning, position, replacement level, and playing time.
The third is wRC+. It asks how strong a hitter was after adjusting for league and park context, with 100 set as league average.
Each measure is useful.
Each measure answers a different question.
That is why this comparison matters.
A player can dominate by z-score because he separates from his third-base peers. A player can dominate by WAR because he accumulates value across many seasons. A player can dominate by wRC+ because his offensive rate quality is extraordinary.
The goal of this chapter is not to declare that one metric is correct and the others are wrong.
The goal is to compare the stories they tell.
For Study 1, I focused on regular third basemen with at least five qualified third-base seasons and matched values for career WAR, career wRC+, and our career z-score measures. That produced a working sample of 239 third basemen.
The central question is:
Which third basemen remain elite when judged by z-scores, WAR, and wRC+ together?
The answer begins with Mike Schmidt.
Across the three-metric composite, Schmidt is the clear anchor of the study. He ranks first in combined z-score, first in WAR, and second in wRC+. He is the player who survives every test.
But the rest of the list is more interesting than a simple ranking.
Eddie Mathews, Chipper Jones, Wade Boggs, George Brett, Home Run Baker, Alex Rodriguez, Ron Santo, Scott Rolen, and Jose Ramirez also emerge as strong cross-metric performers.
At the same time, several players reveal the tension between the metrics.
Brooks Robinson ranks extremely high by combined z-score and WAR, but much lower by wRC+. Dick Allen ranks first by wRC+, but much lower by combined z-score and WAR. Adrian Beltre ranks third by WAR but much lower by wRC+.
Those differences are not problems.
They are the point of the chapter.
The Three Metrics
This study compares three broad dimensions: Combined career z-score, career WAR, and career wRC+.
The combined z-score is internal to this project. WAR and wRC+ are external validation measures.
The three metrics are not interchangeable.
They measure different things.
The Combined Z-Score
The combined z-score is based on two career components: Model C offensive career score and Traditional defensive career score.
Each career score is standardized across the third-base regular sample.
The standardized offensive score is:
z_{\mathrm{Offense},i} = \frac{ \mathrm{Offense}_{i} - \overline{\mathrm{Offense}} }{ s_{\mathrm{Offense}} }The standardized defensive score is:
z_{\mathrm{Defense},i} = \frac{ \mathrm{Defense}_{i} - \overline{\mathrm{Defense}} }{ s_{\mathrm{Defense}} }The combined z-score is:
\mathrm{Combined\ Z}_{i} = z_{\mathrm{Offense},i} + z_{\mathrm{Defense},i}This score rewards players who separate from other third basemen in both offensive and traditional defensive dimensions.
It is not the same thing as WAR.
It does not directly assign run values. It does not use replacement level. It does not use park factors in the way WAR or wRC+ does. It is a peer-separation measure.
That is its strength.
It asks:
How far did this third baseman stand from the position?
WAR
WAR is a broader value metric.
In this chapter, WAR is used as a career value measure for the player’s qualified third-base seasons in our merged dataset. WAR includes offense, defense, baserunning, positional value, replacement value, and playing time.
For the purpose of this chapter, we can think of WAR abstractly as:
\begin{aligned} \mathrm{WAR}_i &= \mathrm{Offense}_i + \mathrm{Defense}_i + \mathrm{Baserunning}_i \\ &\quad+ \mathrm{Position}_i + \mathrm{Replacement}_i \end{aligned}That is not intended as a full WAR formula. It is a conceptual summary.
WAR asks a different question from the z-score model.
It asks:
How much total value did this player produce?
That is why Adrian Beltre, Wade Boggs, Brooks Robinson, Scott Rolen, Graig Nettles, and Buddy Bell can look stronger by WAR than they do by wRC+ alone.
WAR values more than hitting.
wRC+
wRC+ is an offensive rate measure.
It is scaled so that 100 is league average:
wRC^+ = 100A hitter with a 120 wRC+ is roughly 20 percent better than league average offensively:
wRC^+ = 120A hitter with an 80 wRC+ is roughly 20 percent below league average offensively:
wRC^+ = 80For this study, wRC+ answers a narrower question:
How good was the hitter?
It does not measure third-base defense. It does not measure total career value. It does not reward playing third base well. It isolates offensive rate quality.
That is why Dick Allen can rank first in wRC+ without ranking first in the other systems.
Why a Composite Score Is Useful
Because the three measures use different scales, we cannot simply add raw z-score, WAR, and wRC+.
Instead, I converted each metric into a percentile rank.
For each player:
P_{\mathrm{Combined\ Z},i} = \mathrm{PercentileRank}(\mathrm{Combined\ Z}_i) P_{\mathrm{WAR},i} = \mathrm{PercentileRank}(\mathrm{WAR}_i) P_{wRC^+,i} = \mathrm{PercentileRank}(wRC^+_i)Then I calculated a three-metric composite percentile:
\mathrm{Composite}_{i} = \frac{ P_{\mathrm{Combined\ Z},i} + P_{\mathrm{WAR},i} + P_{wRC^+,i} }{3}This composite is not meant to replace the individual metrics. It is a summary tool.
It rewards broad agreement.
A player who ranks high in all three metrics will rise. A player who is exceptional in one metric but weaker in the others will still be visible, but not necessarily at the top of the composite.
That is why this study is useful.
It separates all-around consensus from metric-specific greatness.
Figure 1: The Top 25 Composite Performers
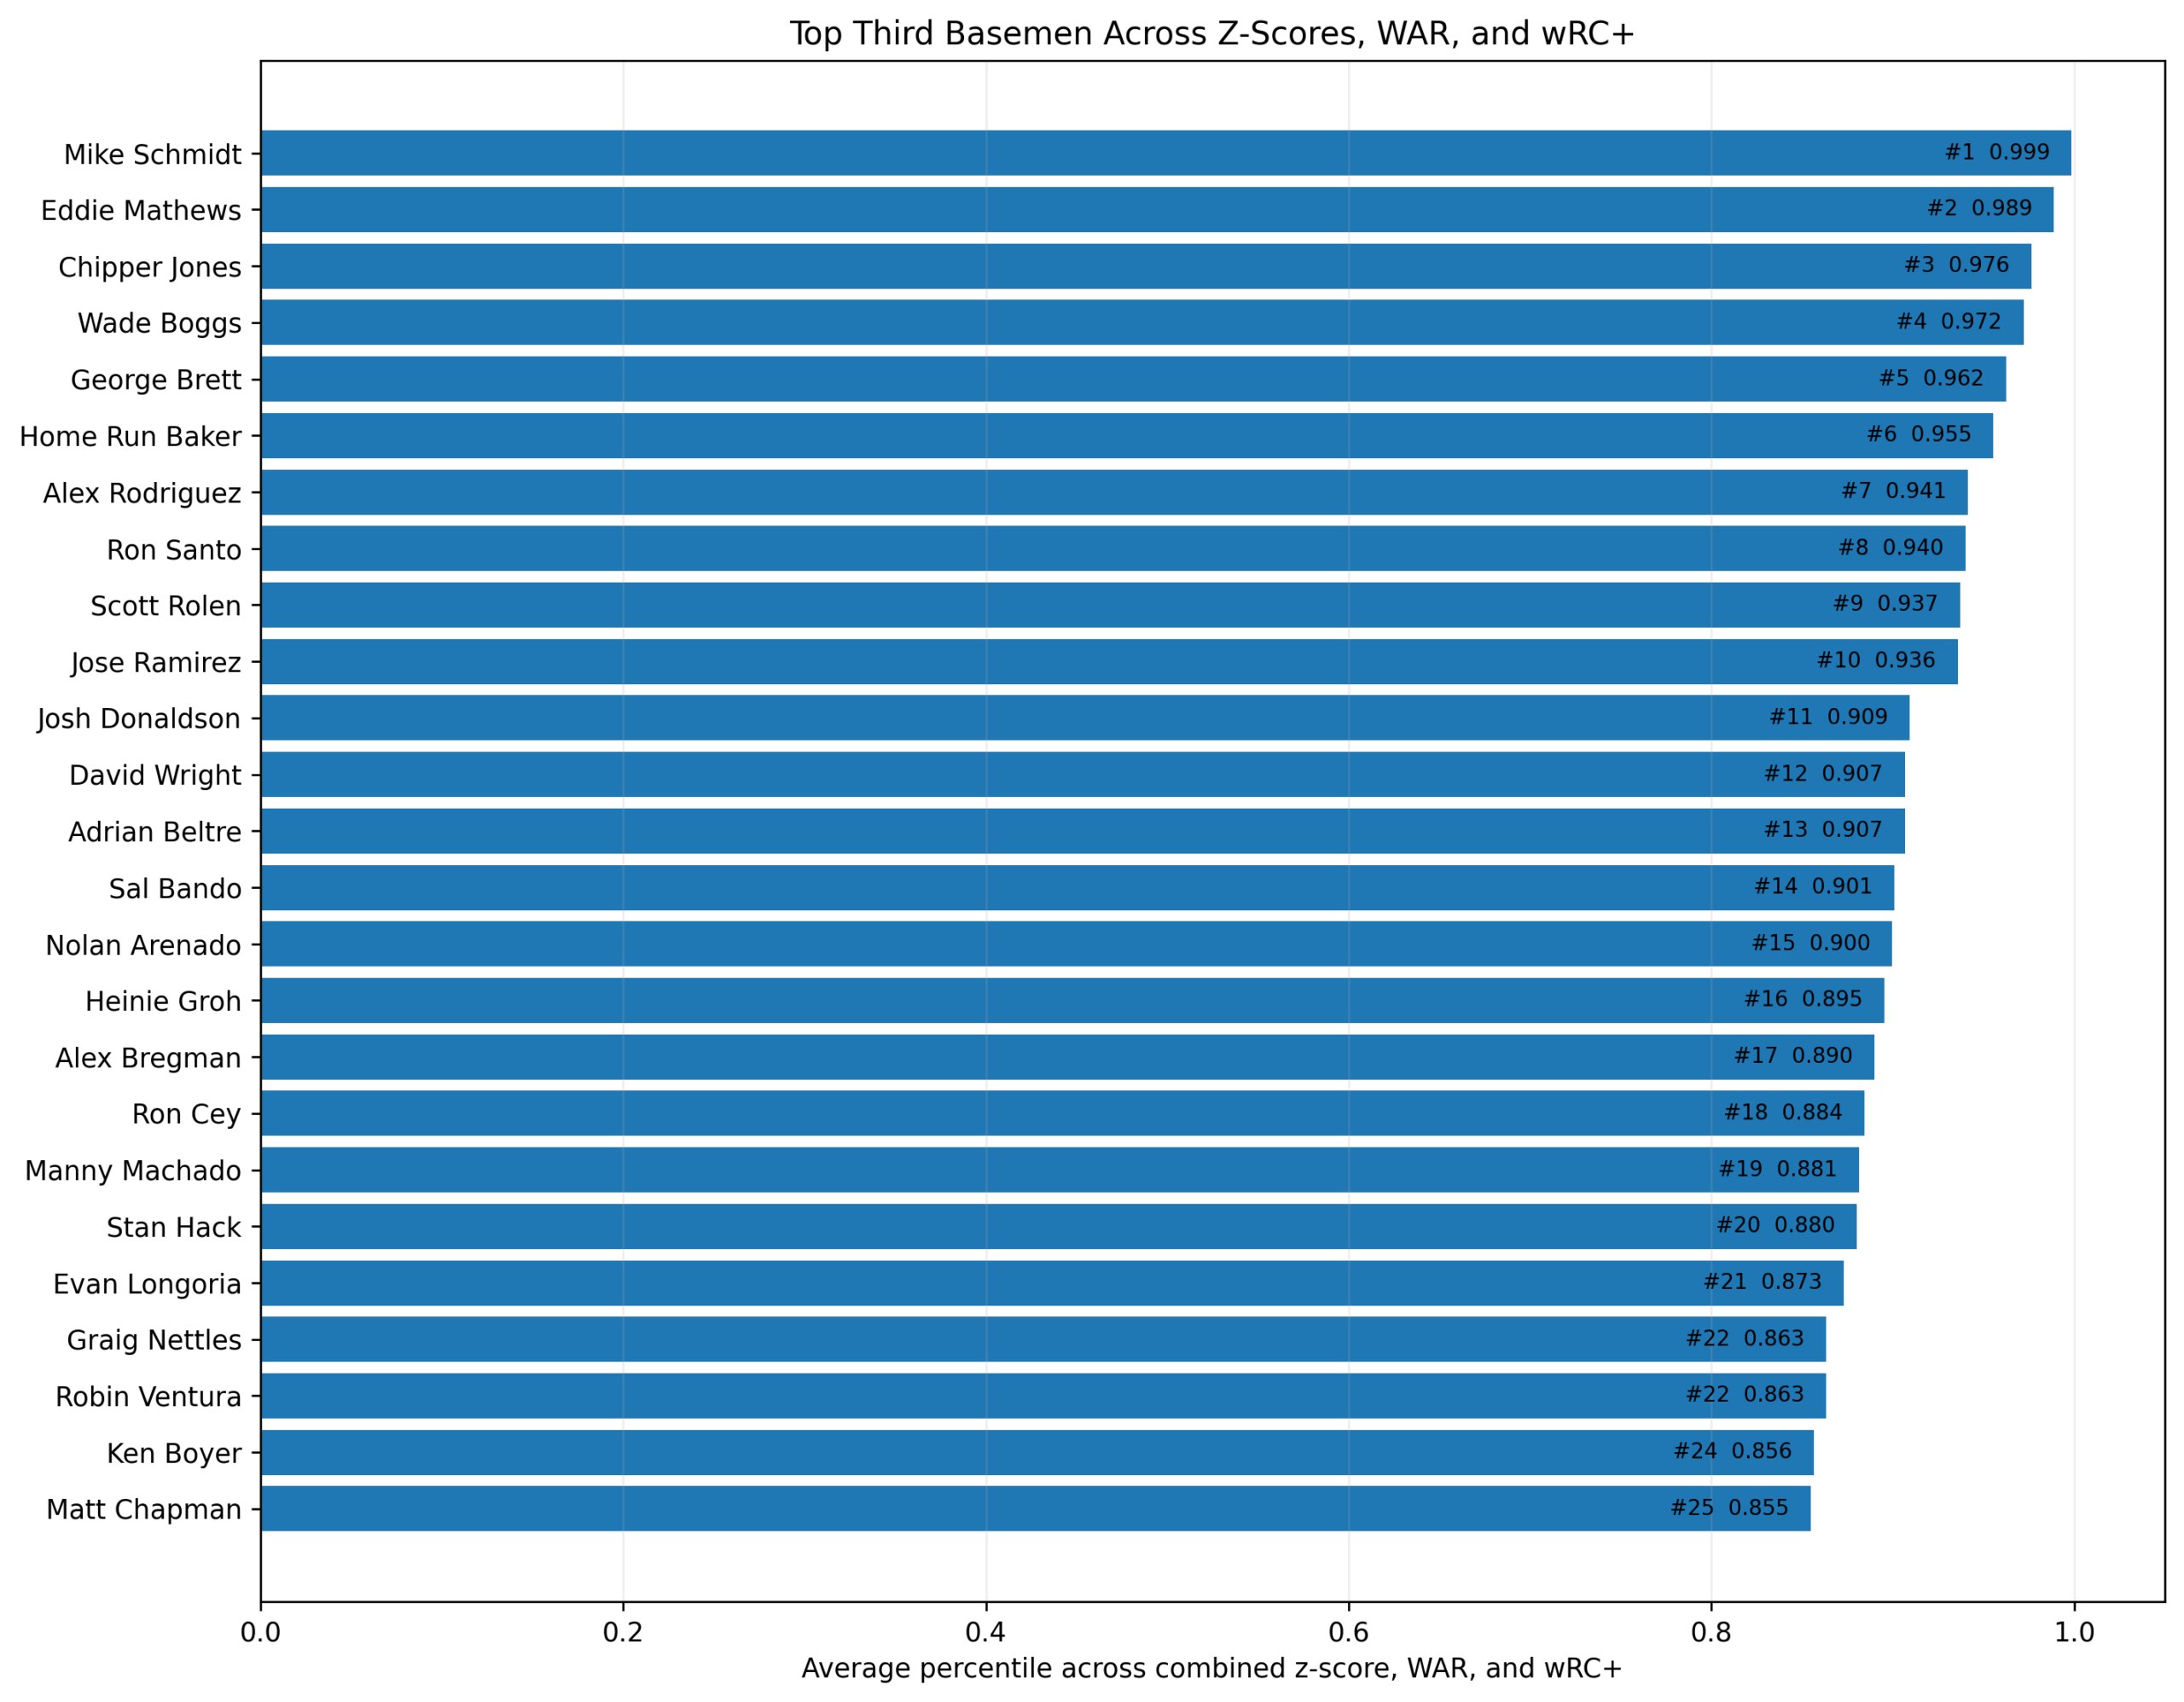
Figure 1. Top third basemen across combined z-score, WAR, and wRC+.
The top 25 composite chart gives the broadest view of the results.
The top ten are:1. Mike Schmidt 2. Eddie Mathews 3. Chipper Jones 4. Wade Boggs 5. George Brett 6. Home Run Baker 7. Alex Rodriguez 8. Ron Santo 9. Scott Rolen 10. Jose Ramirez.
It is not simply an offensive list. Brooks Robinson does not reach the top ten because wRC+ pulls him down, but the list still includes two-way and value-based players such as Wade Boggs, Ron Santo, and Scott Rolen.
It is not simply a WAR list either. Adrian Beltre ranks third by WAR, but thirteenth by the composite because his wRC+ rank is lower than his WAR and z-score ranks.
It is not simply a wRC+ list. Dick Allen ranks first by wRC+, but he does not land near the top of the composite because his combined z-score and WAR ranks are lower.
The top composite list rewards players who remain strong across the different definitions of greatness.
That is why Schmidt is first.
He is not merely great by one method. He is great by all three.
The Top Players by Each Metric
The top players change depending on the question.
By combined z-score, the top five are: 1. Mike Schmidt 2. Brooks Robinson 3. Nolan Arenado 4. Scott Rolen 5. Wade Boggs.
This list rewards two-dimensional separation. Robinson and Arenado rise because traditional defense is included.
By WAR, the top five are: 1. Mike Schmidt 2. Eddie Mathews 3. Adrian Beltre 4. Wade Boggs 5. Brooks Robinson.
This list rewards total value and career accumulation.
By wRC+, the top five are: 1. Dick Allen 2. Mike Schmidt 3. Eddie Mathews 4. Harmon Killebrew 5. John McGraw.
This list rewards offensive rate quality.
These are three different lists because they are answering three different questions.
The question is not which list is correct.
The question is what each list reveals.
Figure 2: Rank Movement Across the Three Systems
![]()
Figure 2. How the top composite third basemen rank by combined z-score, WAR, and wRC+.
The rank-comparison figure shows how players move across the three measures.
Mike Schmidt barely moves. That is the signature of a consensus number one. His profile is not dependent on one definition of value.
Eddie Mathews is similarly strong. He ranks high in WAR and wRC+, and still remains strong in the combined z-score system.
Chipper Jones is also stable. His defensive score is not strong, but his offensive value is so high that he remains near the top.
The movement becomes more interesting with players like Adrian Beltre, Nolan Arenado, and Scott Rolen.
Beltre ranks extremely high by WAR but much lower by wRC+. That makes sense. His case is not purely about offensive rate. It is about durability, defense, and total value.
Arenado ranks very high by combined z-score but much lower by wRC+. Again, that makes sense. His profile is two-dimensional and defense-forward.
Rolen is a balanced case. He ranks very high by combined z-score and WAR but lower by wRC+. That reflects his two-way value.
This figure shows that the metrics are not redundant.
They overlap, but they do not tell the same story.
Figure 3: Combined Z-Score Versus WAR
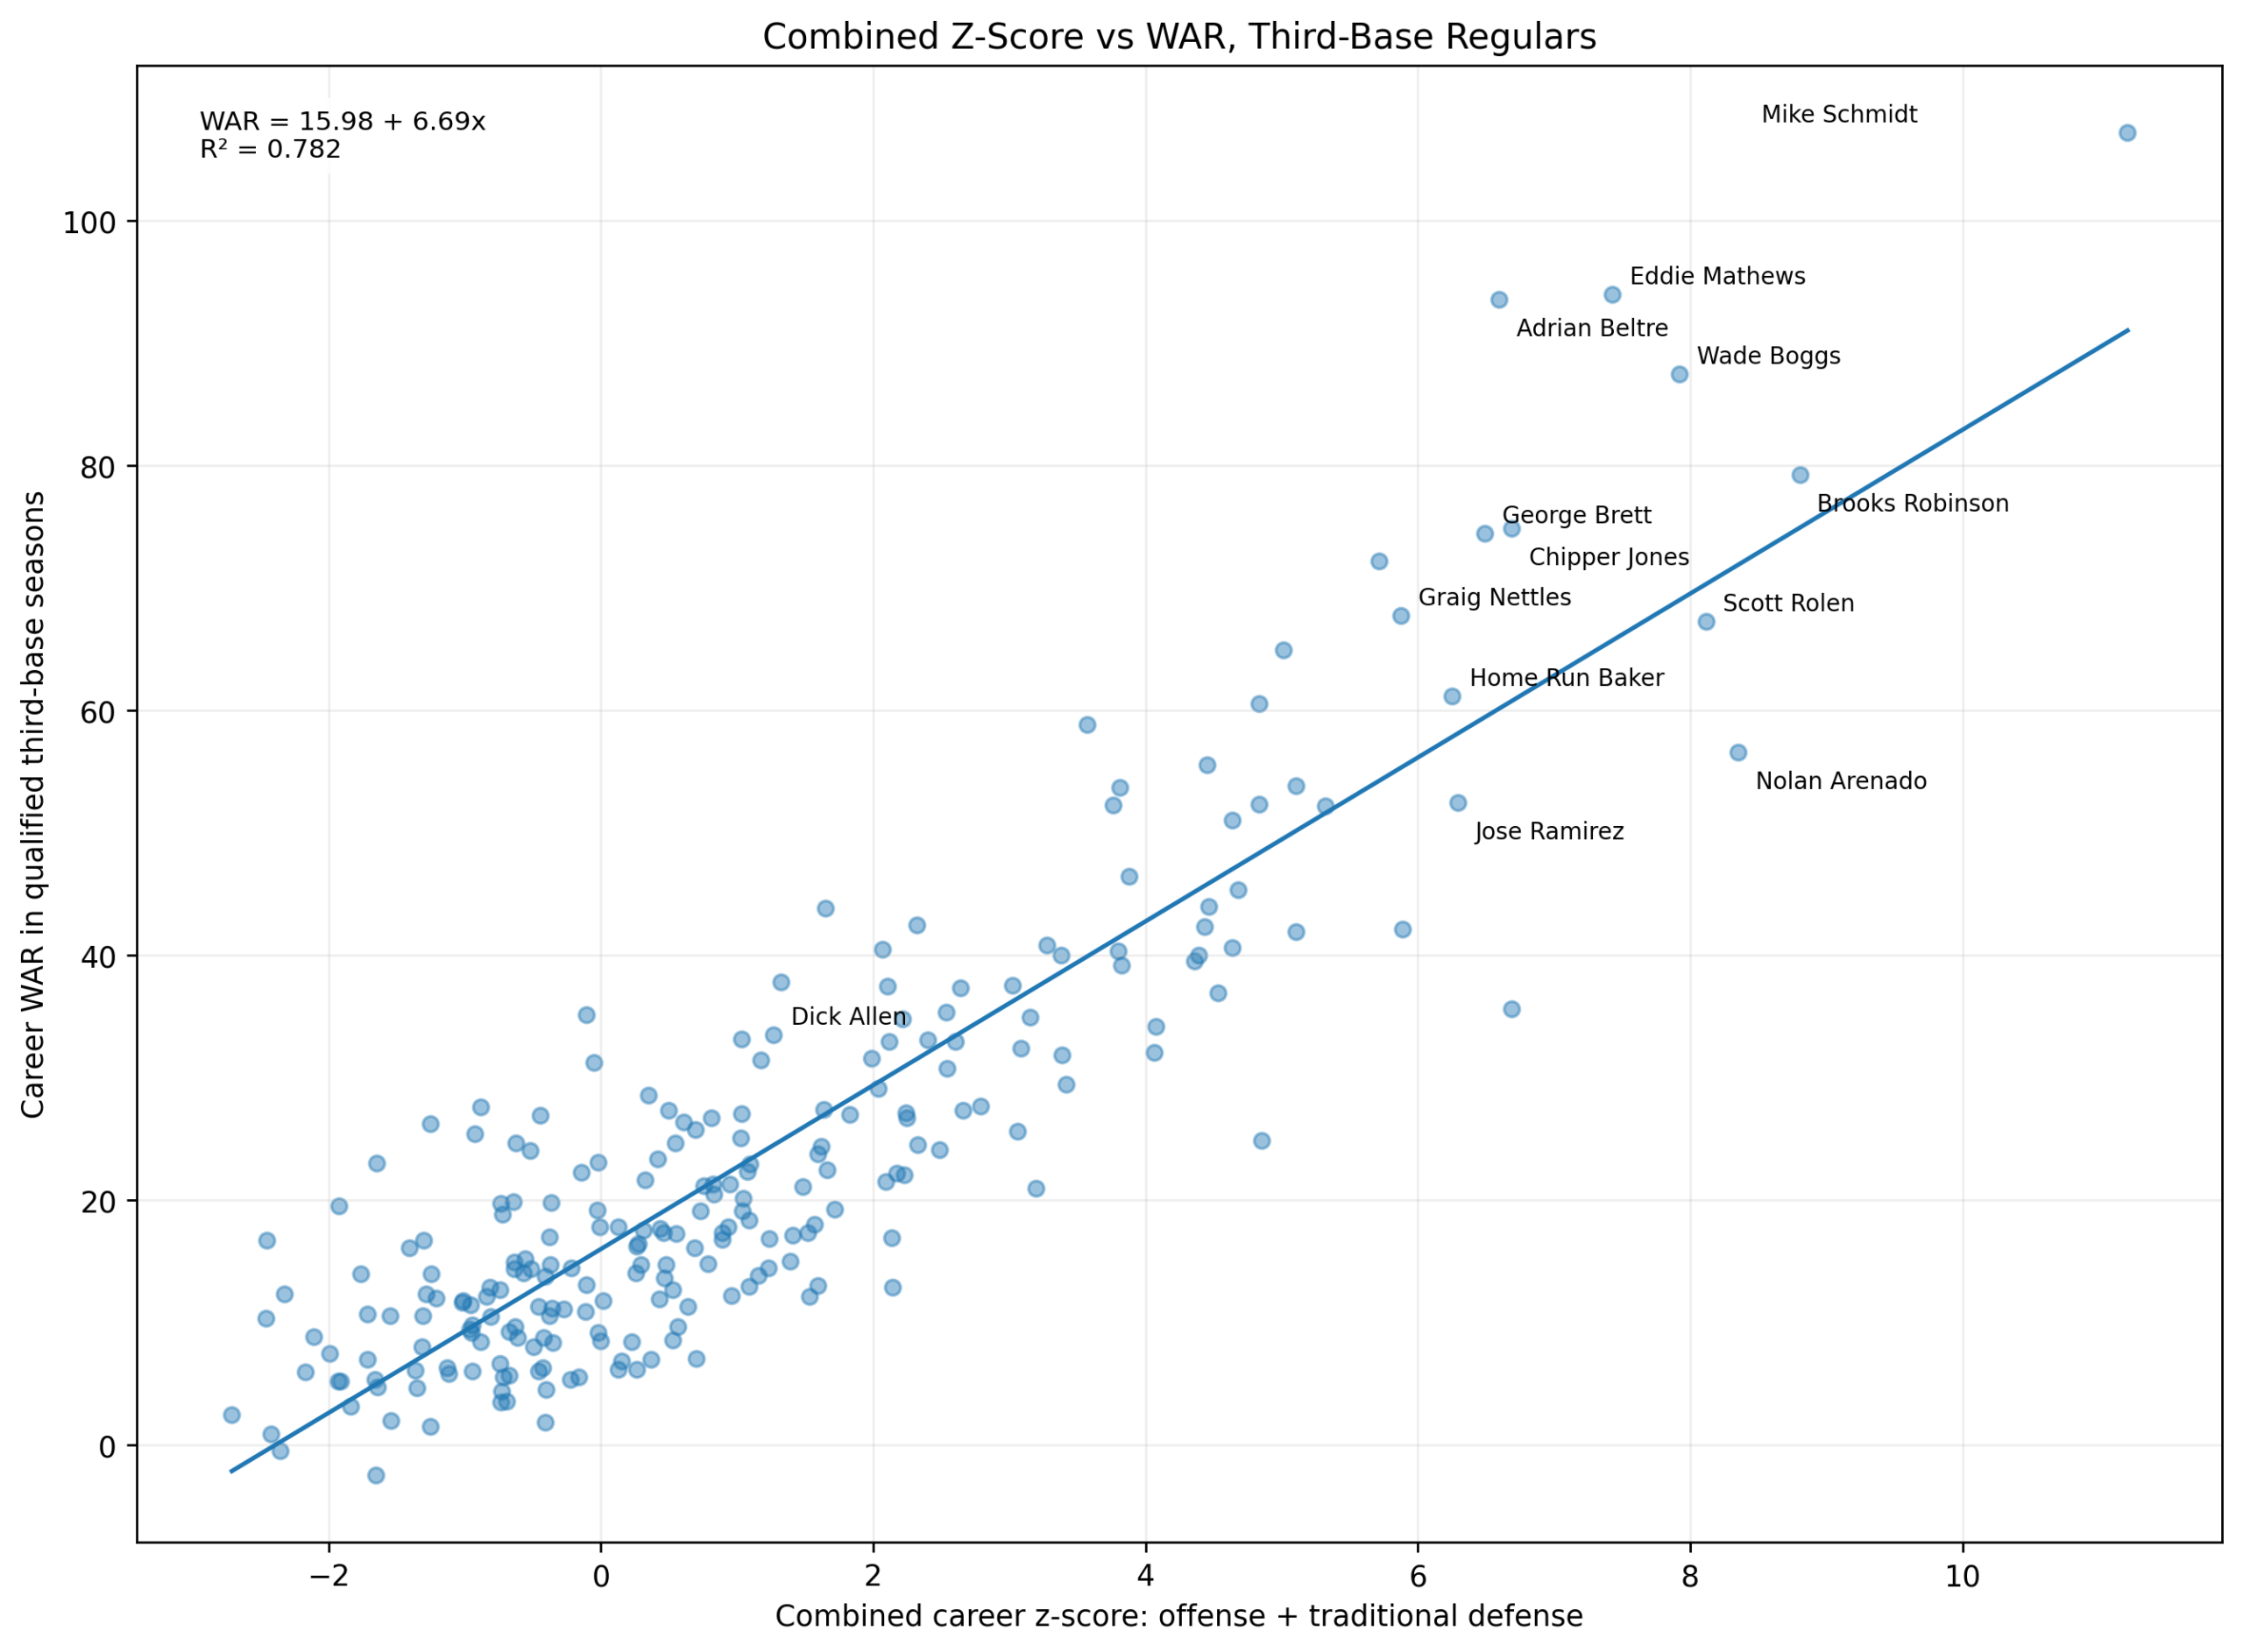
Figure 3. Combined career z-score versus career WAR among third-base regulars.
The combined z-score and WAR relationship is strong.
The fitted line is:
\mathrm{WAR} = 15.98 + 6.69(\mathrm{Combined\ Z})The model fit is:
R^2 = 0.782That means the combined z-score explains a large share of the variation in career WAR among third-base regulars.
This is important.
It tells us that our z-score framework is not just an internal ranking system. It aligns strongly with a major external value metric.
But the scatterplot also shows meaningful differences.
Mike Schmidt sits at the upper-right extreme. His combined z-score and WAR both identify him as historically exceptional.
Brooks Robinson sits high in combined z-score and WAR, but his shape is different. His combined z-score is powered by traditional defense rather than offensive dominance.
Adrian Beltre sits higher in WAR than his combined z-score alone would predict. That suggests his total value, longevity, and broader WAR components are stronger than the simplified z-score model fully captures.
Nolan Arenado sits high in combined z-score but lower in WAR relative to the line. That may reflect career length, active-career status, or differences between traditional defensive separation and WAR’s defensive valuation.
The relationship is strong, but the residuals still matter.
They show where the systems disagree.
Figure 4: Offensive Z-Score Rate Versus wRC+
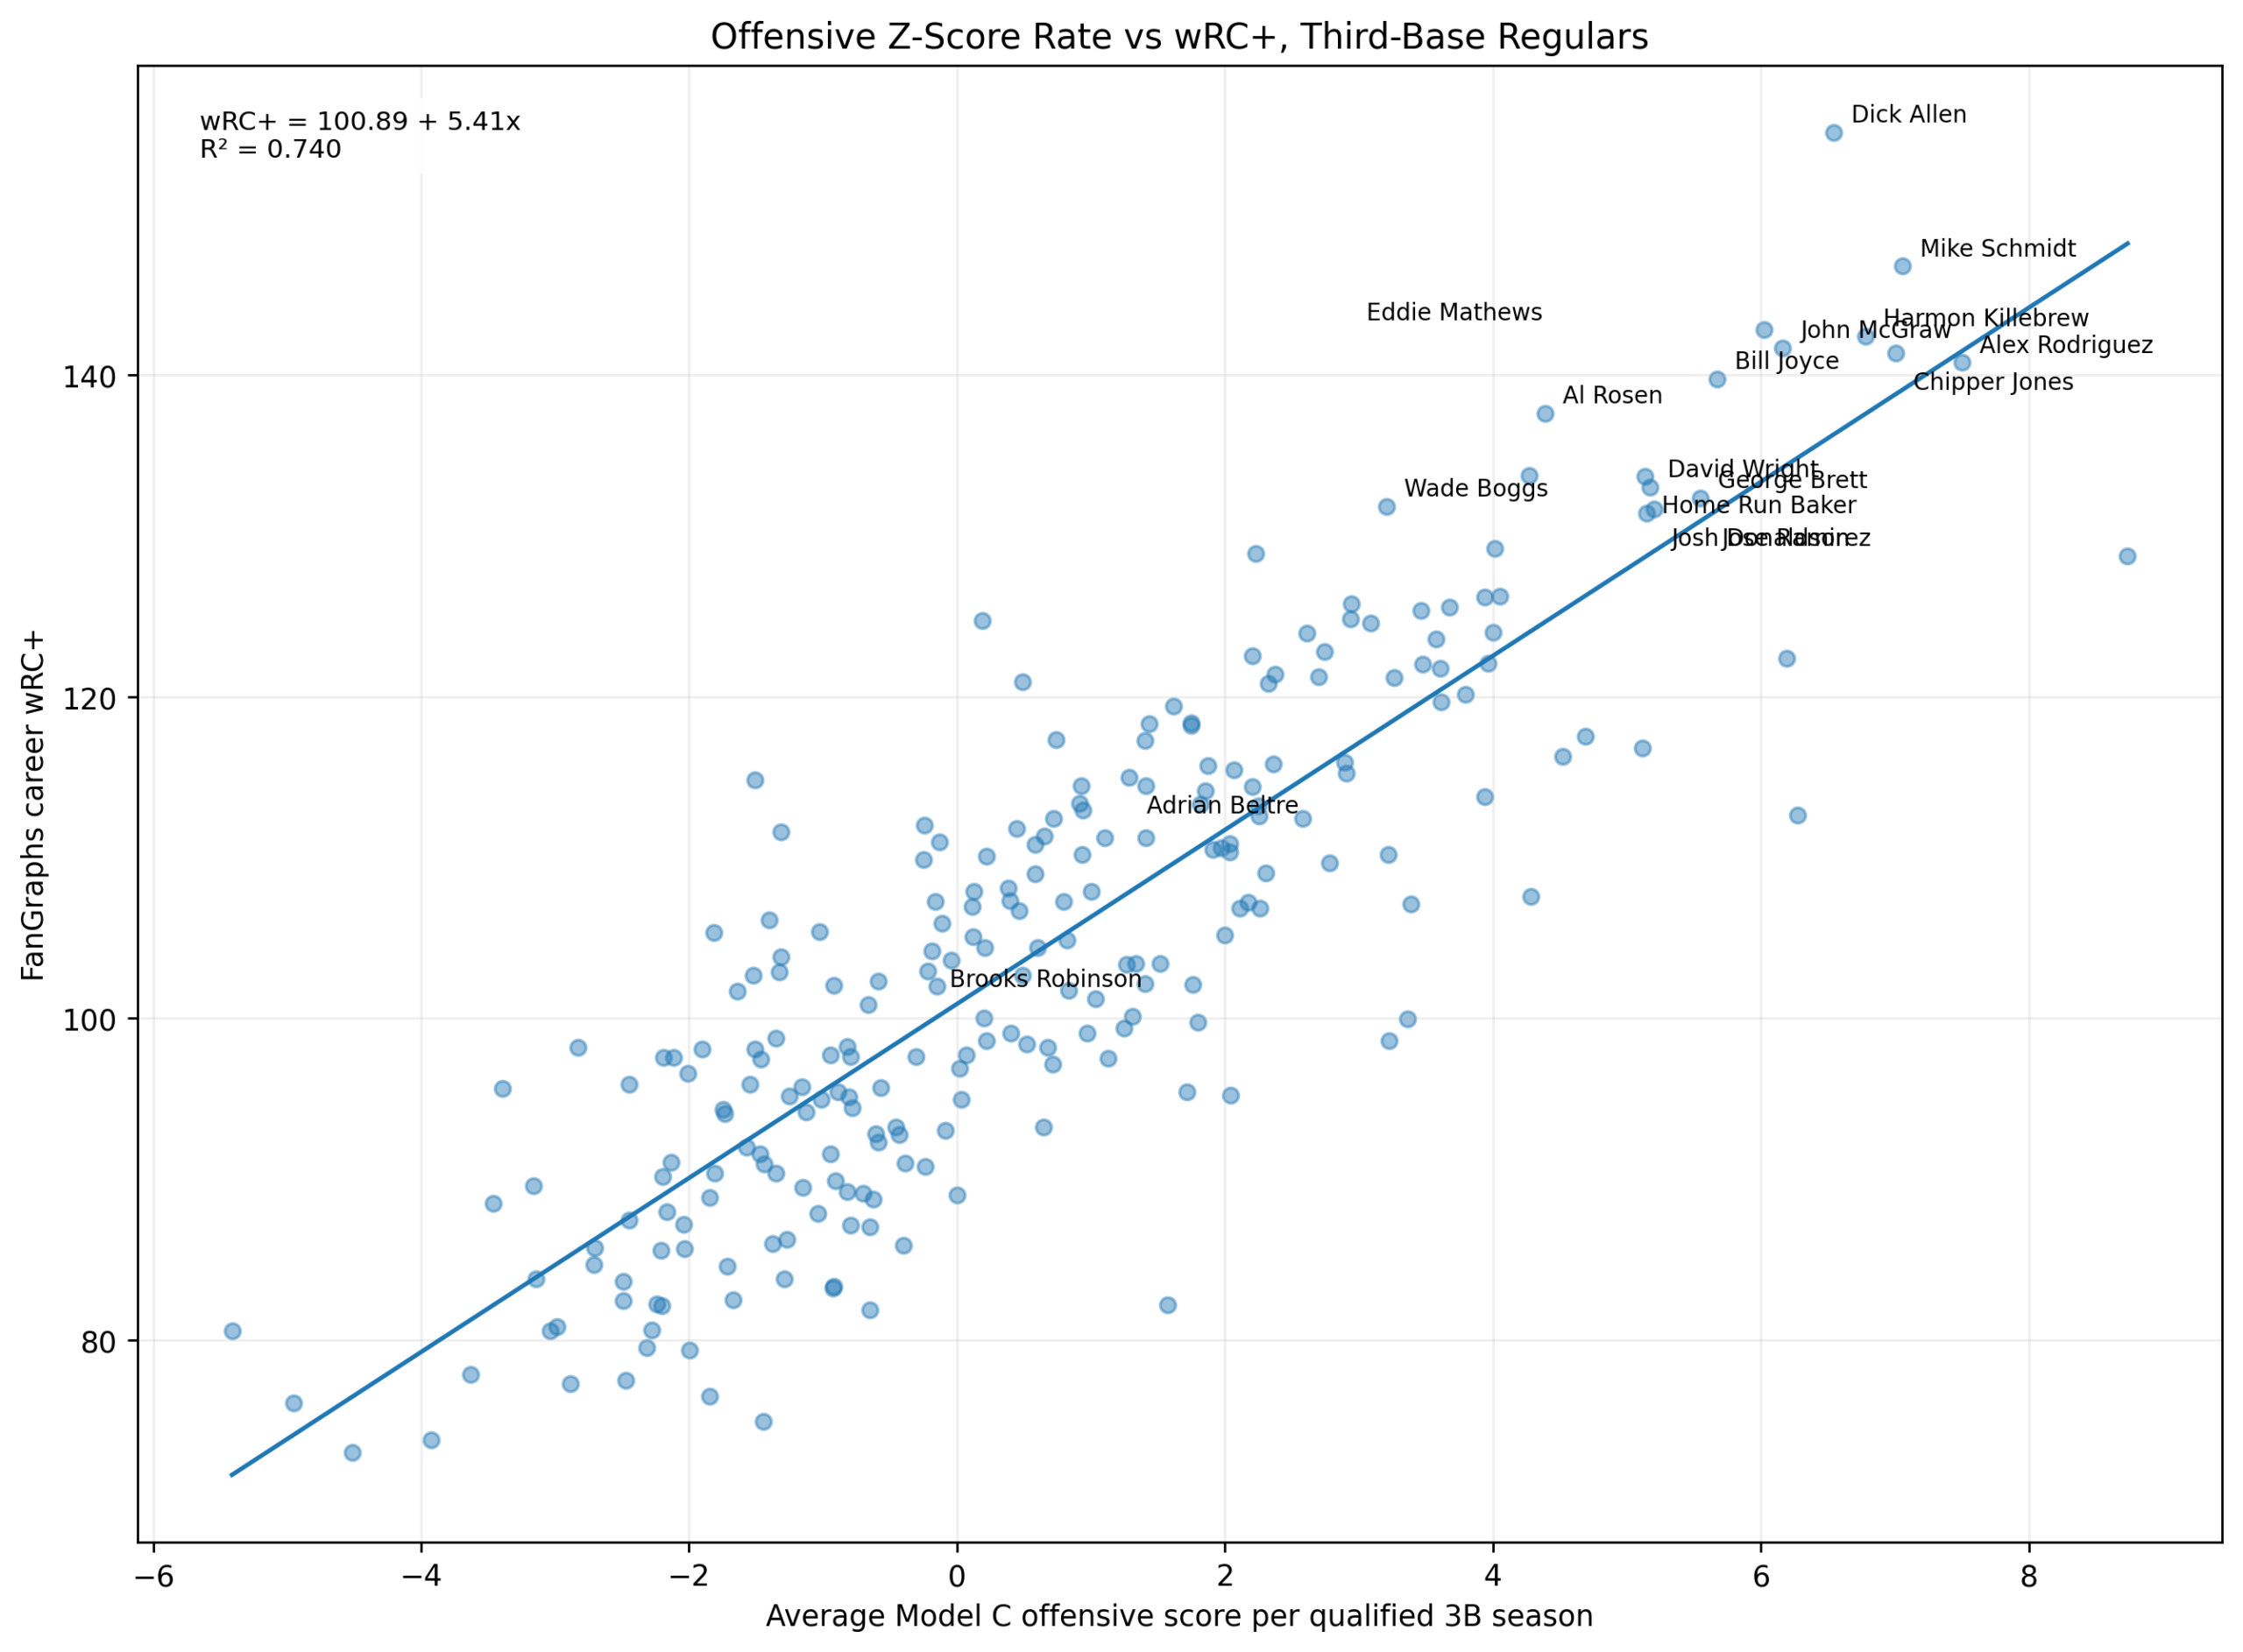
Figure 4. Average offensive z-score per qualified third-base season versus career wRC+.
The relationship between average offensive z-score and wRC+ is also strong.
The fitted line is:
wRC^+ = 100.89 + 5.41(\mathrm{Average\ Offensive\ Z})The fit is:
R^2 = 0.740This confirms the earlier wRC+ validation result.
Average offensive z-score is a strong predictor of wRC+ because both are measuring offensive quality, though in different ways.
The equation says that each additional point of average offensive z-score corresponds to about 5.41 additional points of career wRC+:
\beta_1 = 5.41This is why the offensive names rise in this figure.
Dick Allen, Mike Schmidt, Eddie Mathews, Chipper Jones, Alex Rodriguez, George Brett, Home Run Baker, Wade Boggs, Al Rosen, and David Wright all appear as strong offensive profiles.
Brooks Robinson, by contrast, is much closer to the middle of the wRC+ distribution. That is not a criticism. It simply reflects that Robinson’s greatness is not primarily a wRC+ case.
That is exactly why this comparison matters.
Figure 5: Cross-Metric Rank Disagreements
![]()
Figure 5. Largest cross-metric rank disagreements among notable third basemen.
The disagreement chart is one of the most useful figures in the study.
It identifies players whose rankings differ sharply across combined z-score, WAR, and wRC+.
The rank spread is:
\begin{aligned} \mathrm{RankSpread}_{i} &= \max\left( r_{\mathrm{CombinedZ},i}, r_{\mathrm{WAR},i}, r_{\mathrm{wRC}^{+},i} \right) \\ &\quad- \min\left( r_{\mathrm{CombinedZ},i}, r_{\mathrm{WAR},i}, r_{\mathrm{wRC}^{+},i} \right) \end{aligned}A large spread means the player looks very different depending on the metric.
Some of the most interesting disagreement cases are: Brooks Robinson, Dick Allen, Adrian Beltre, Nolan Arenado, Willie Kamm, Gary Gaetti, Harmon Killebrew, Edwin Encarnacion, Jim Ray Hart, and Deacon White.
These players are not mistakes in the data.
They are interpretive opportunities.
Brooks Robinson is a defensive and WAR giant, but not a wRC+ giant.
Dick Allen is an offensive-rate giant, but not a top combined z-score or WAR third-base regular in this framework.
Adrian Beltre is a WAR giant, but wRC+ does not fully capture his case.
Willie Kamm is extremely strong by the combined z-score framework because of traditional defense, but he is not similarly high by wRC+.
Edwin Encarnacion is much stronger by wRC+ than by third-base z-score or WAR within the third-base framework, partly because his career offensive identity extends beyond a long regular third-base profile.
The disagreement chart shows why a single number is not enough.
The Schmidt Result
Mike Schmidt is the central result of Study 1.
He ranks: Combined z-score rank: 1 WAR rank: 1 wRC+ rank: 2 Composite rank: 1
This is almost the perfect cross-metric profile.
Schmidt is not merely the best by our internal model. He is also the best by WAR and nearly the best by wRC+.
That matters because it means his result is robust.
He is not a product of one method.
He is the player who remains elite when the question changes.
If the question is peer separation, Schmidt wins.
If the question is total value, Schmidt wins.
If the question is offensive rate quality, Schmidt is still almost at the top.
That is the strongest possible case.
Eddie Mathews, Chipper Jones, and the Offensive Greatness Group
Eddie Mathews ranks second by the composite.
He ranks: Combined z-score rank: 6 WAR rank: 2 wRC+ rank: 3 Composite rank: 2.
That is a very strong cross-metric profile. Mathews does not have Schmidt’s complete separation, but he remains elite everywhere.
Chipper Jones ranks third by the composite: Combined z-score rank: 8 WAR rank: 6 wRC+ rank: 6 Composite rank: 3.
Chipper’s case is offense-forward. His traditional defensive component is not strong, but his offensive quality is so high that he remains elite across the systems.
George Brett and Home Run Baker also belong in this broad offensive greatness group. They are strong by wRC+, strong by WAR, and strong enough by combined z-score to remain near the top.
This group shows that offensive greatness can carry a third-base profile a long way.
Wade Boggs and the On-Base Profile
Wade Boggs ranks fourth by the composite: Combined z-score rank: 5 WAR rank: 4 wRC+ rank: 14 Composite rank: 4.
Boggs is a fascinating case because he is not a home-run power archetype. His greatness is built around contact, on-base skill, batting average, plate discipline, and sustained offensive quality.
The fact that he ranks so highly in the composite confirms that the model is not simply rewarding slugging power.
Boggs was a different kind of offensive star, and the metrics recognize it.
Rolen, Beltre, Arenado, and Two-Way Value
Scott Rolen, Adrian Beltre, and Nolan Arenado show why WAR and combined z-score are necessary companions to wRC+.
Rolen ranks: Combined z-score rank: 4 WAR rank: 10 wRC+ rank: 34 Composite rank: 9.
Beltre ranks: Combined z-score rank: 9 WAR rank: 3 wRC+ rank: 58 Composite rank: 13.
Arenado ranks: Combined z-score rank: 3 WAR rank: 15 wRC+ rank: 57 Composite rank: 15.
These are not weak wRC+ players. But their all-time third-base cases are not primarily wRC+ cases.
They are two-way cases.
Rolen is balanced. Beltre is a total-value and longevity case. Arenado is a defense-forward combined z-score case.
If this study used only wRC+, these players would be underrated.
If it used only WAR, their offensive shape would be less visible.
If it used only z-score, the relationship to broader value would be less clear.
The three-metric comparison gives the fuller picture.
Brooks Robinson and the Limits of wRC+
Brooks Robinson is the clearest example of a player whose greatness is not offensive-rate greatness.
He ranks: Combined z-score rank: 2 WAR rank: 5 wRC+ rank: 114.
That is a huge split.
It makes perfect sense.
Robinson’s historical case is not based on being one of the greatest offensive third basemen. It is based on defense, durability, and total value.
The combined z-score model sees him because traditional defense is included. WAR sees him because total value includes defense. wRC+ does not see him in the same way because wRC+ is an offensive metric.
That is not a flaw in wRC+. It is a reminder that wRC+ answers a narrower question.
Dick Allen and the Limits of Third-Base Accumulation
Dick Allen is the opposite case.
He ranks: wRC+ rank: 1 Combined z-score rank: 87 WAR rank: 51.
Allen’s offensive rate quality is extraordinary. But within this third-base regular framework, he does not accumulate the same kind of third-base-specific z-score or WAR profile as Schmidt, Mathews, Chipper, Boggs, or Brett.
This shows the difference between a great hitter who played third base and a great third baseman across the entire profile. That is an important distinction.
Allen is not diminished by this result. The study simply clarifies what kind of greatness he represents.
He is a wRC+ giant. He is not the top all-around third-base regular by the three-metric composite.
Why This Study Is Interesting
The value of Study 1 is that it prevents the project from becoming metric-dependent.
If Schmidt ranked first only by our z-score model, the conclusion would be interesting but narrower.
But Schmidt also ranks first by WAR and second by wRC+. That makes the conclusion much stronger.
At the same time, the disagreements prevent the chapter from becoming too simple.
Brooks Robinson, Dick Allen, Adrian Beltre, Nolan Arenado, Rolen, Boggs, and others show that greatness has different forms.
The study therefore supports two conclusions at once: 1. Mike Schmidt is the clearest cross-metric third-base anchor. 2. Different metrics reveal different kinds of third-base greatness.
Both points are important.
Limitations
This chapter uses regular third basemen with at least five qualified third-base seasons and matched values across the three systems. That makes the comparison cleaner, but it also means the study is focused on third-base regulars, not every player who ever appeared at third base.
The combined z-score uses this project’s offensive Model C and traditional defensive model. It does not include modern defensive metrics, park factors, or full run-value modeling.
WAR includes many components that the z-score model does not.
wRC+ is a rate statistic and should not be treated as an accumulated career value measure. That is why the study includes average offensive z-score per qualified season when comparing to wRC+.
The composite percentile score is a summary tool. It is not a new definitive metric. It is best used to identify players who remain strong across multiple systems.
Conclusion
Study 1 compares three ways of measuring third-base greatness: Combined z-score, WAR, and wRC+
The main result is clear.
Mike Schmidt is the strongest cross-metric third baseman in the study.
He ranks first by combined z-score, first by WAR, second by wRC+, and first by the three-metric composite.
Eddie Mathews, Chipper Jones, Wade Boggs, George Brett, Home Run Baker, Alex Rodriguez, Ron Santo, Scott Rolen, and Jose Ramirez also emerge as strong cross-metric performers.
But the disagreements are just as important.
Brooks Robinson shows that wRC+ cannot capture defensive greatness.
Dick Allen shows that offensive rate greatness is not the same as all-around third-base accumulation.
Adrian Beltre, Nolan Arenado, and Scott Rolen show the importance of two-way value.
The larger conclusion is this:
Third-base greatness is not one-dimensional.
Z-scores show peer separation.
WAR shows total value.
wRC+ shows offensive quality.
The best third basemen are the ones who remain visible when the lens changes.
By that standard, Mike Schmidt stands at the center of the argument.
![]()