The Shape of Defense: What MLB Fielding Metrics Tell Us So Far This Season
Defense is the hardest part of baseball to measure cleanly. I thought it might be interesting to study all MLB teams as of the end of June 2026.
Hitting leaves a visible trail. A batter walks, strikes out, singles, doubles, homers, or makes an out. Pitching is more complicated, but it still has a fairly direct statistical language. Strikeouts, walks, home runs, velocity, chase rate, and contact quality all point in recognizable directions. Defense is different. Good defense often appears as absence. The ball that does not fall. The extra base that is not taken. The throw that does not need to be dramatic because the fielder got to the ball early enough.
That makes defensive analysis both frustrating and interesting. One number rarely tells the whole story. Fielding percentage tells us whether a team usually completes the plays it reaches, but it says little about how many plays it reaches in the first place. Errors measure visible mistakes, but not invisible range. Modern metrics try to correct for that. Defensive Runs Saved, Outs Above Average, Fielding Run Value, FanGraphs Def, framing value, arm value, and range value each capture a different part of the defensive picture.
For this study, I used three FanGraphs team defensive leaderboards. The goal was not simply to rank teams. The better question is how the different defensive systems agree, where they disagree, and what kind of defense each team is actually playing.
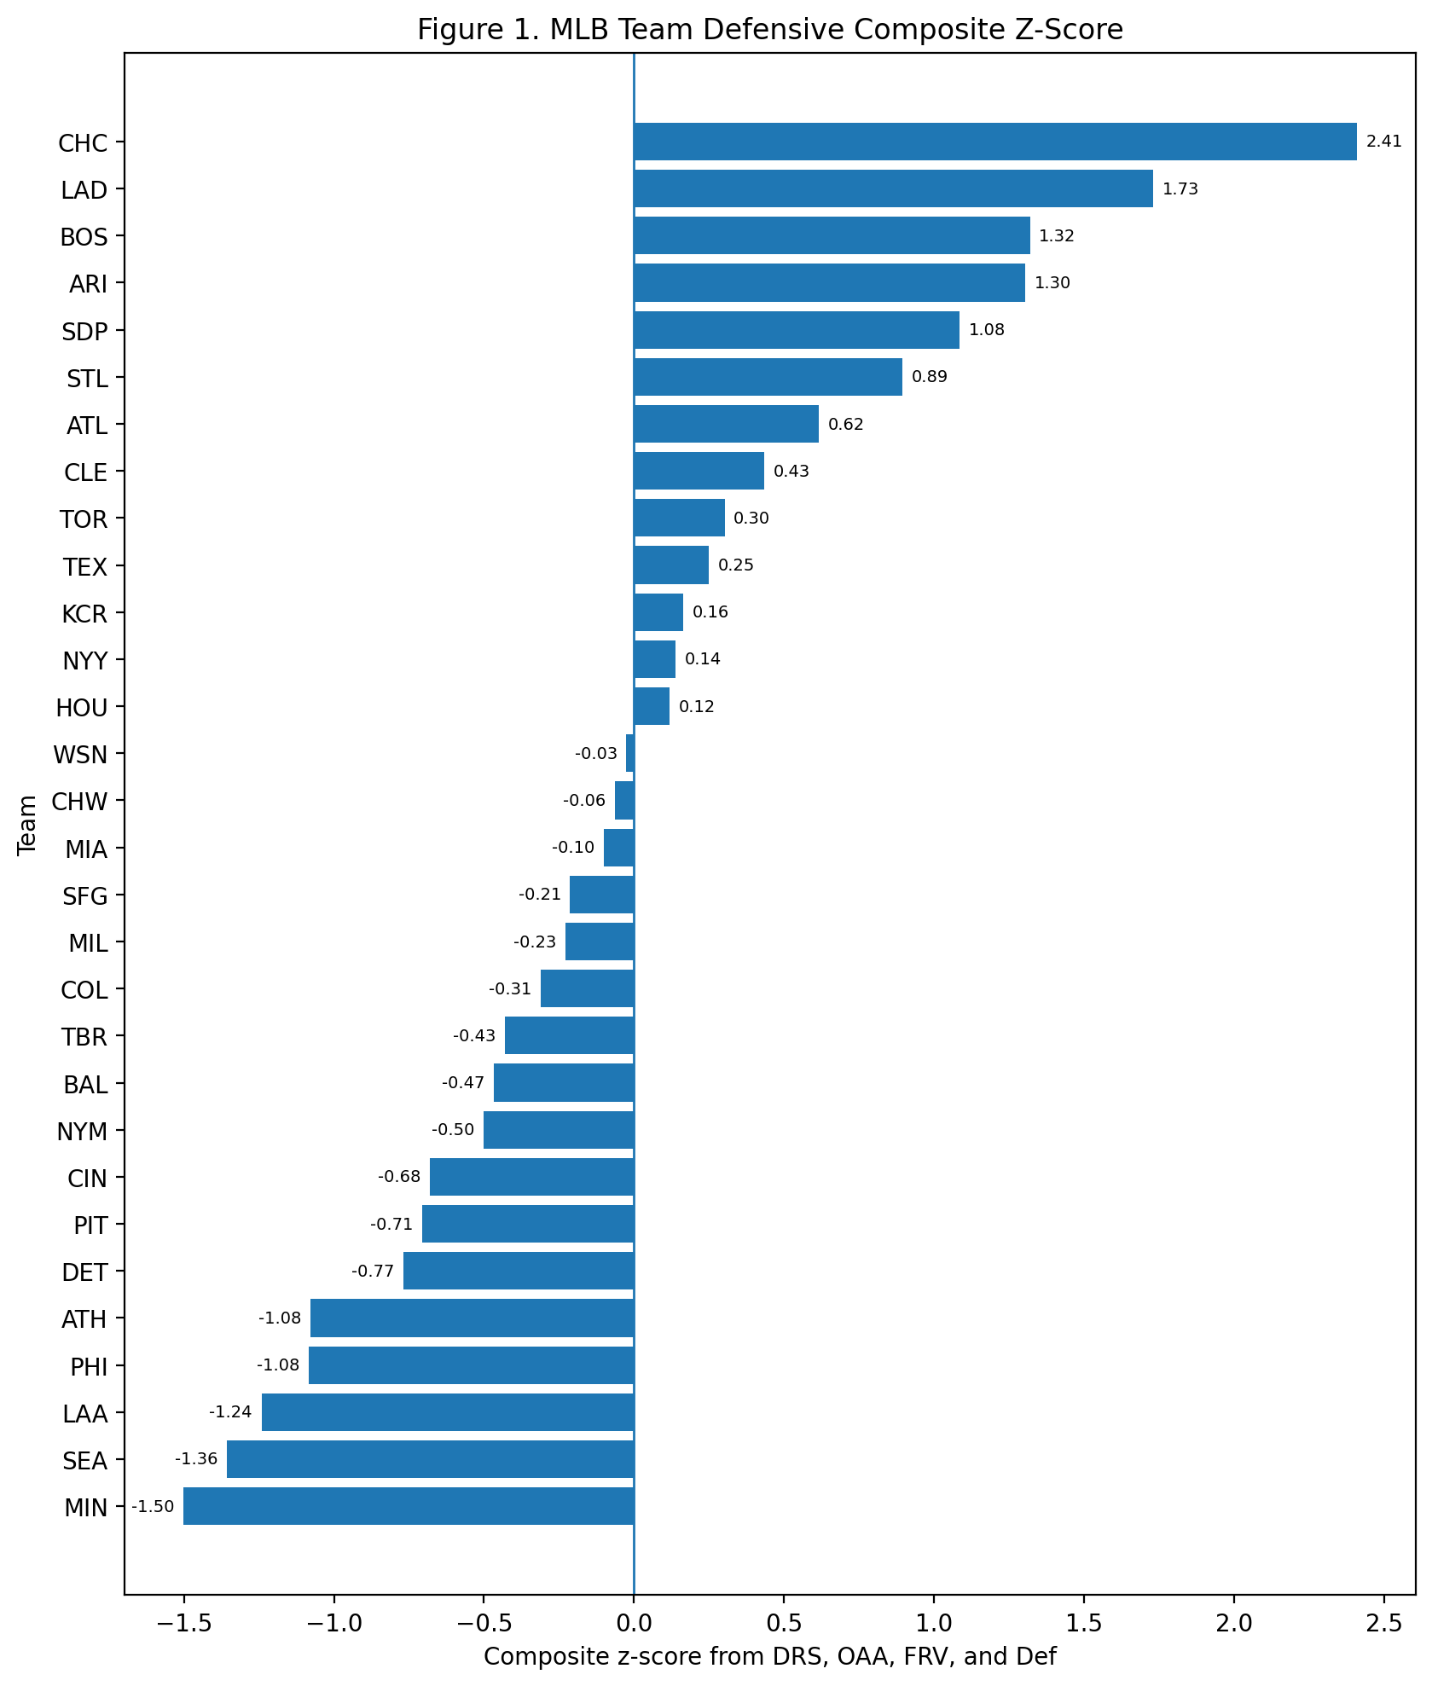
The main conclusion is clear: so far this season, the Cubs are the strongest defensive team in baseball by a wide margin. But the deeper conclusion is more interesting. OAA, FRV, and FanGraphs Def are telling very similar stories. DRS is related to those measures, but it is not identical. Traditional fielding percentage has some relationship to defensive value, but not nearly enough to stand on its own.
Defense, in other words, is not one thing.
Building a Composite Defensive Score
To compare teams across multiple defensive systems, I created a composite z-score using four broad measures:
- Defensive Runs Saved, or DRS
- Outs Above Average, or OAA
- Fielding Run Value, or FRV
- FanGraphs Def
Each metric was standardized across the 30 MLB teams. The z-score for team (i) on metric (m) is:
z_{i,m} = \frac{x_{i,m} - \mu_m}{\sigma_m}where (x_{i,m}) is team (i)’s value on metric (m),
(\mu_m)is the league average for that metric,
and (\sigma_m) is the standard deviation across teams.
The composite defensive score is then:
D_i = \frac{ z_{i,\mathrm{DRS}} + z_{i,\mathrm{OAA}} + z_{i,\mathrm{FRV}} + z_{i,\mathrm{Def}} }{4}This score does not claim that all defensive metrics are perfect or equally philosophical. It is simply a way to ask a practical question: which teams look good across several major defensive metrics simultaneously?
The top of the list is not subtle.
| Rank | Team | Composite Z | DRS | OAA | FRV | Def |
|---|---|---|---|---|---|---|
| 1 | CHC | 2.41 | 57 | 38 | 34 | 34.06 |
| 2 | LAD | 1.73 | 61 | 23 | 20 | 21.77 |
| 3 | BOS | 1.32 | 42 | 18 | 17 | 19.20 |
| 4 | ARI | 1.30 | 25 | 23 | 23 | 19.08 |
| 5 | SDP | 1.08 | 17 | 16 | 22 | 19.61 |
| 6 | STL | 0.89 | 18 | 16 | 20 | 10.75 |
The Cubs are not merely first. They are first by a lot. Their composite z-score is 2.41, meaning they are far above league average across the combined defensive measures. The Dodgers are also excellent, but they are closer to the next group than they are to Chicago.
At the other end of the chart, the weakest defensive teams are also fairly clear.
| Team | Composite Z | DRS | OAA | FRV | Def |
|---|---|---|---|---|---|
| MIN | -1.50 | -32 | -19 | -19 | -17.35 |
| SEA | -1.36 | -2 | -27 | -22 | -18.83 |
| LAA | -1.24 | -3 | -18 | -23 | -19.03 |
| PHI | -1.08 | -29 | -18 | -9 | -7.46 |
| ATH | -1.08 | -4 | -19 | -16 | -15.51 |
Minnesota rates last by the composite score. Seattle and the Angels are also deep in negative territory, though they arrive there in slightly different ways. Minnesota is hurt badly by DRS and modern range-based measures. Seattle is particularly poor by OAA and FRV standards. The Angels are near the bottom in FRV and FanGraphs Def.
The first lesson is that the defensive standings have a clear shape. Chicago is alone at the top. Los Angeles leads the next tier. Boston, Arizona, San Diego, and St. Louis form a strong second group. At the bottom, Minnesota, Seattle, Los Angeles Angels, Philadelphia, and the Athletics are the weakest group.
But rankings are only the beginning.
OAA and FRV Mostly Agree
The tightest relationship in the study is between Outs Above Average and Fielding Run Value.
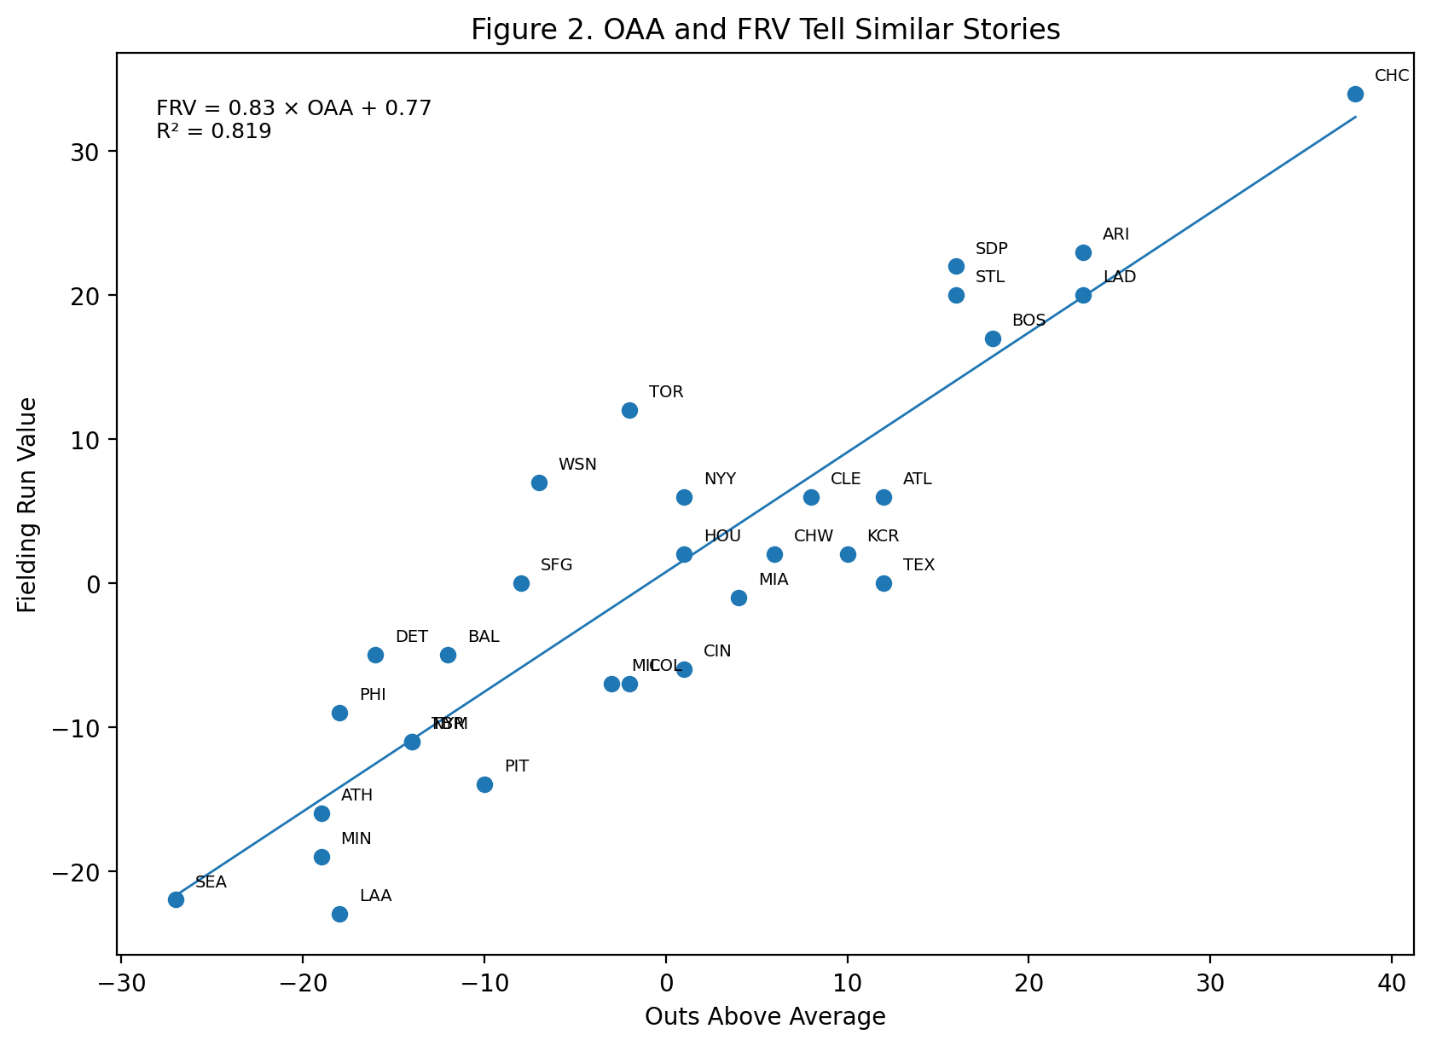
The regression equation is:
\mathrm{FRV}_i = 0.83 \cdot \mathrm{OAA}_i + 0.77with:
R^2 = 0.819That is a strong relationship. This means that about 82% of the variation in team FRV is explained by team OAA in this dataset.
That makes intuitive sense. OAA and FRV are closely related modern defensive concepts. Both are trying to move beyond errors and fielding percentage. Both are interested in actual plays made relative to expected plays. Both reward teams that turn difficult batted balls into outs.
The Cubs sit in the upper-right corner of the chart. They are not just good by one metric. They are extreme by both. Chicago has 38 OAA and 34 FRV. Arizona, Los Angeles, San Diego, Boston, and St. Louis also occupy the positive area of the chart. At the bottom, Seattle, the Angels, Minnesota, and the Athletics cluster in negative territory.
This is useful because it gives confidence. If two modern metrics with related but not identical constructions point in the same direction, the result is more persuasive. The Cubs are not a leaderboard accident. Their defensive advantage appears in multiple systems.
DRS Tells a Related but Different Story
DRS also matters, but it does not align with FRV as tightly as OAA does.
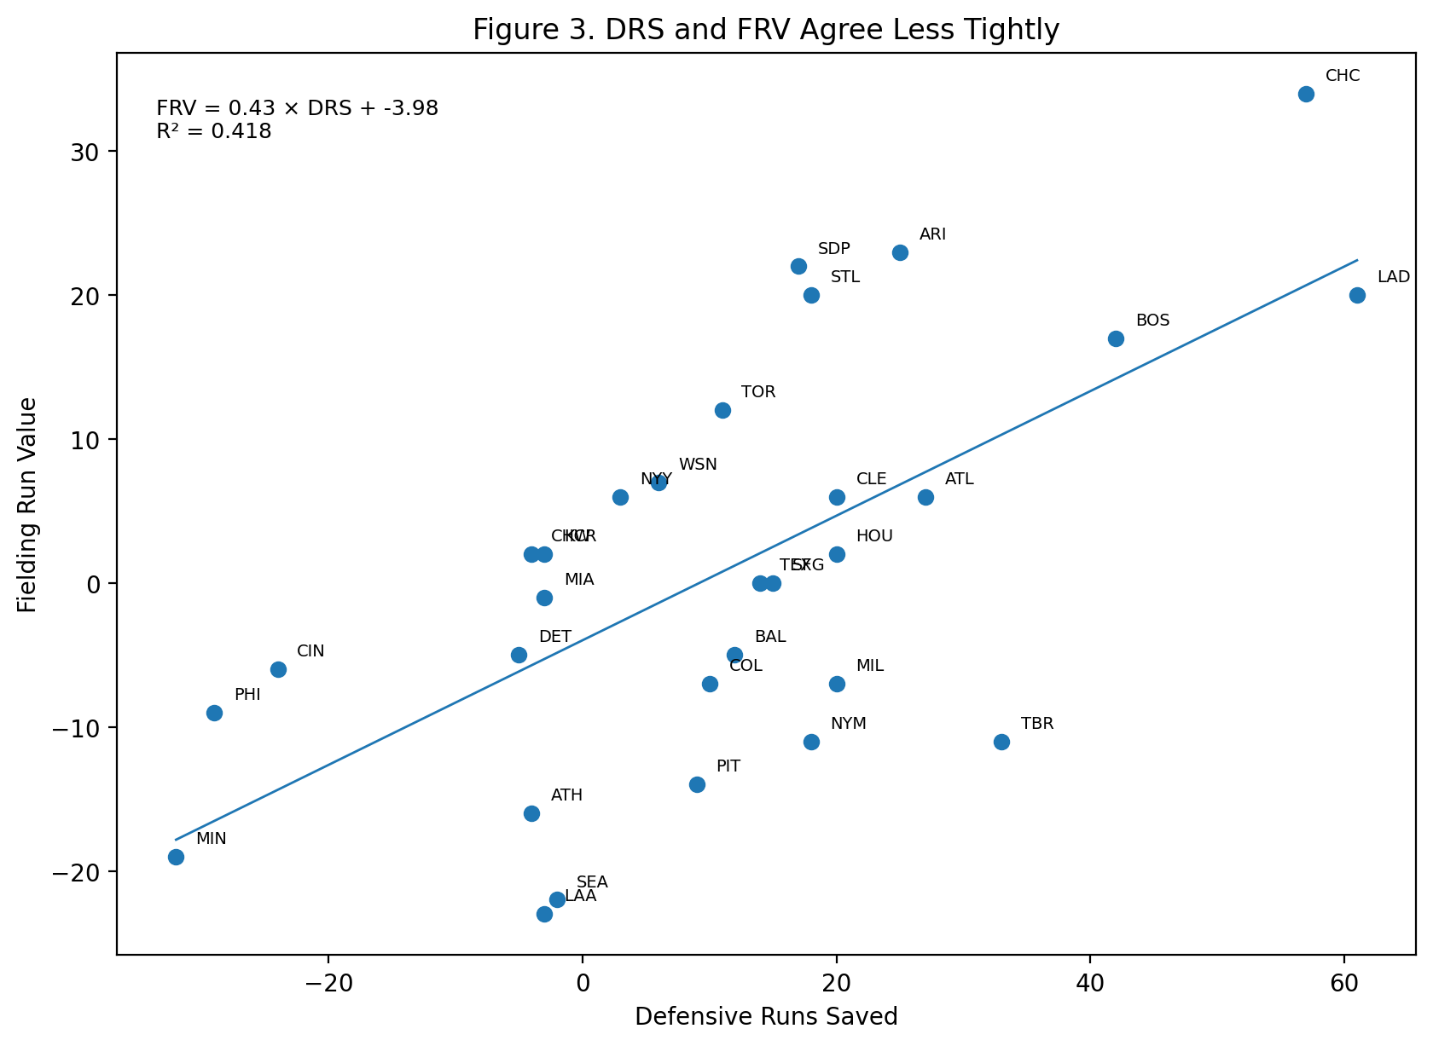
The regression equation is:
\mathrm{FRV}_i = 0.43 \cdot \mathrm{DRS}_i - 3.98with:
R^2 = 0.418That is still a meaningful relationship, but it is much weaker than the OAA-FRV relationship. DRS and FRV are clearly not measuring the same thing in the same way.
This is where the study becomes more interesting. The Dodgers have the highest DRS total in the dataset, with 61, but they trail the Cubs in FRV, OAA, and Def. The Cubs have slightly lower DRS than Los Angeles, but they dominate in OAA and FRV. Tampa Bay is another example of disagreement. The Rays have a positive DRS total, but their FRV is negative. Philadelphia is negative in both, but much worse in DRS than FRV.
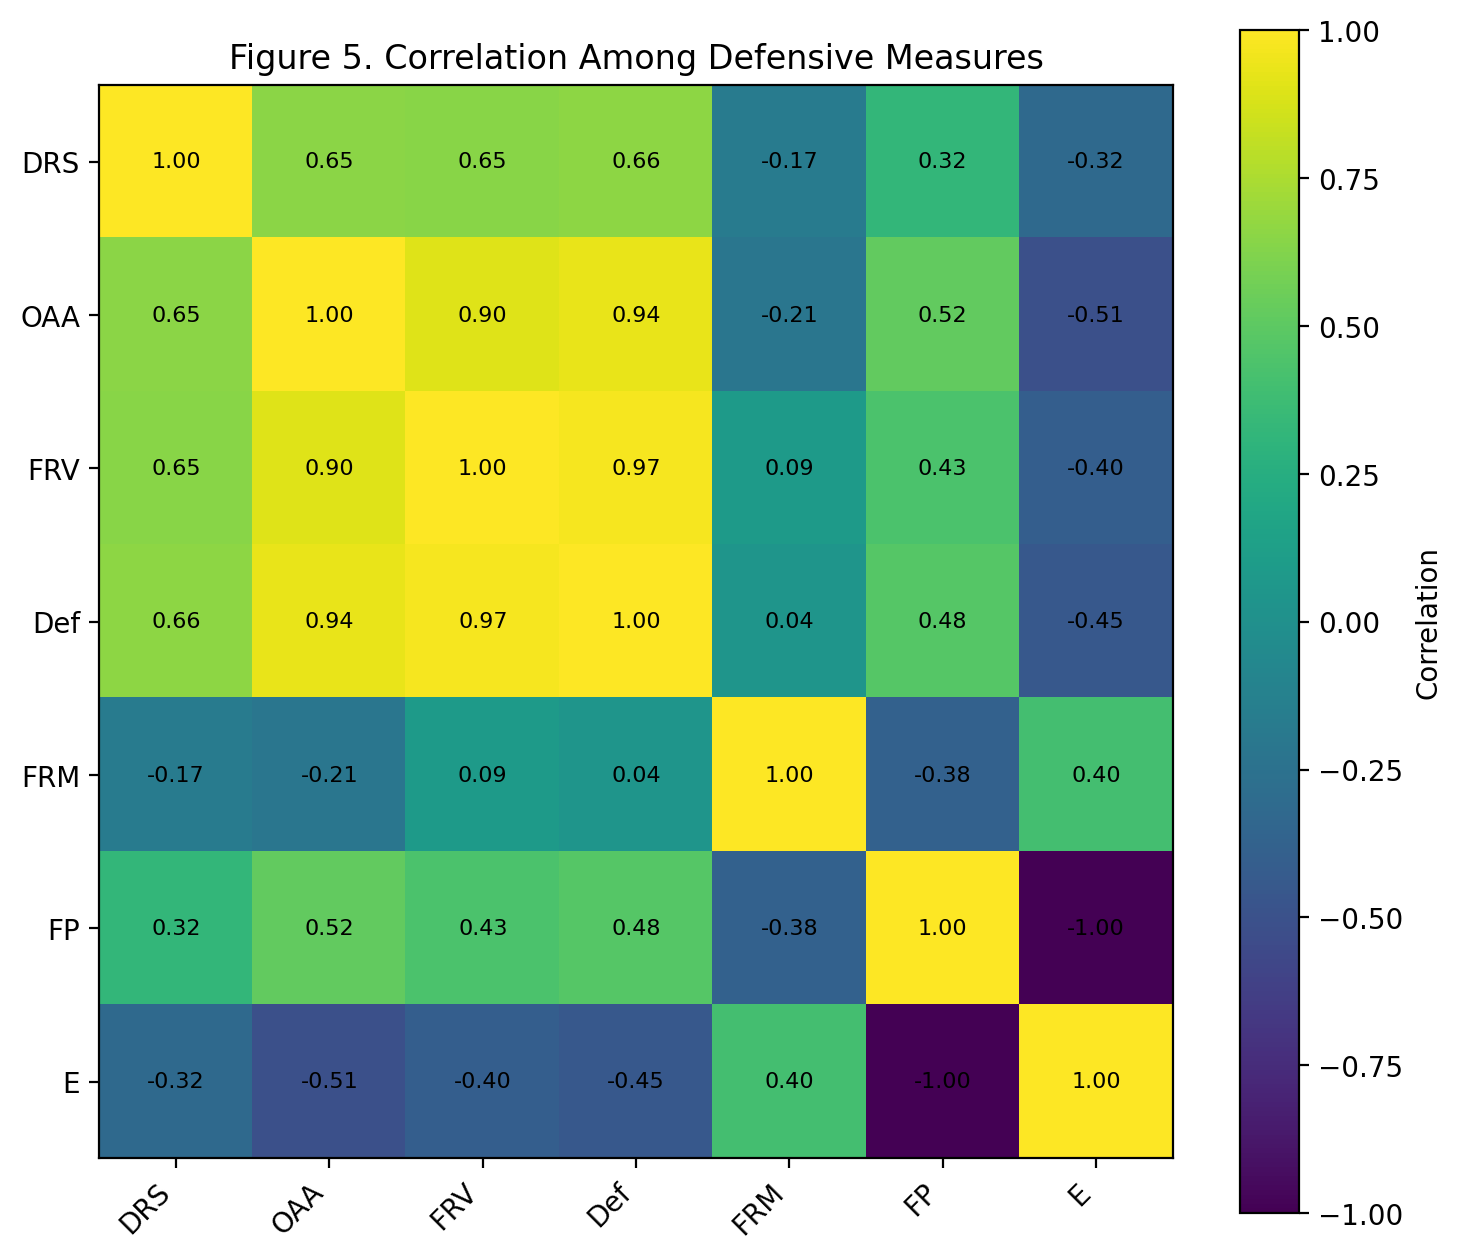
The correlation table reinforces the point. The correlations among the major modern measures are:
| Pair | Correlation |
|---|---|
| OAA and FRV | 0.90 |
| FRV and Def | 0.97 |
| OAA and Def | 0.94 |
| DRS and OAA | 0.65 |
| DRS and FRV | 0.65 |
| DRS and Def | 0.66 |
The formula for correlation is:
r_{XY} = \frac{ \sum_i (x_i - \bar{x})(y_i - \bar{y}) }{ \sqrt{\sum_i (x_i - \bar{x})^2} \sqrt{\sum_i (y_i - \bar{y})^2} }This tells us that DRS belongs in the conversation, but it should not be treated as interchangeable with OAA or FRV. When DRS disagrees with the Statcast-style measures, that disagreement is not a nuisance. It is evidence that defensive measurement still depends on the assumptions built into each system.
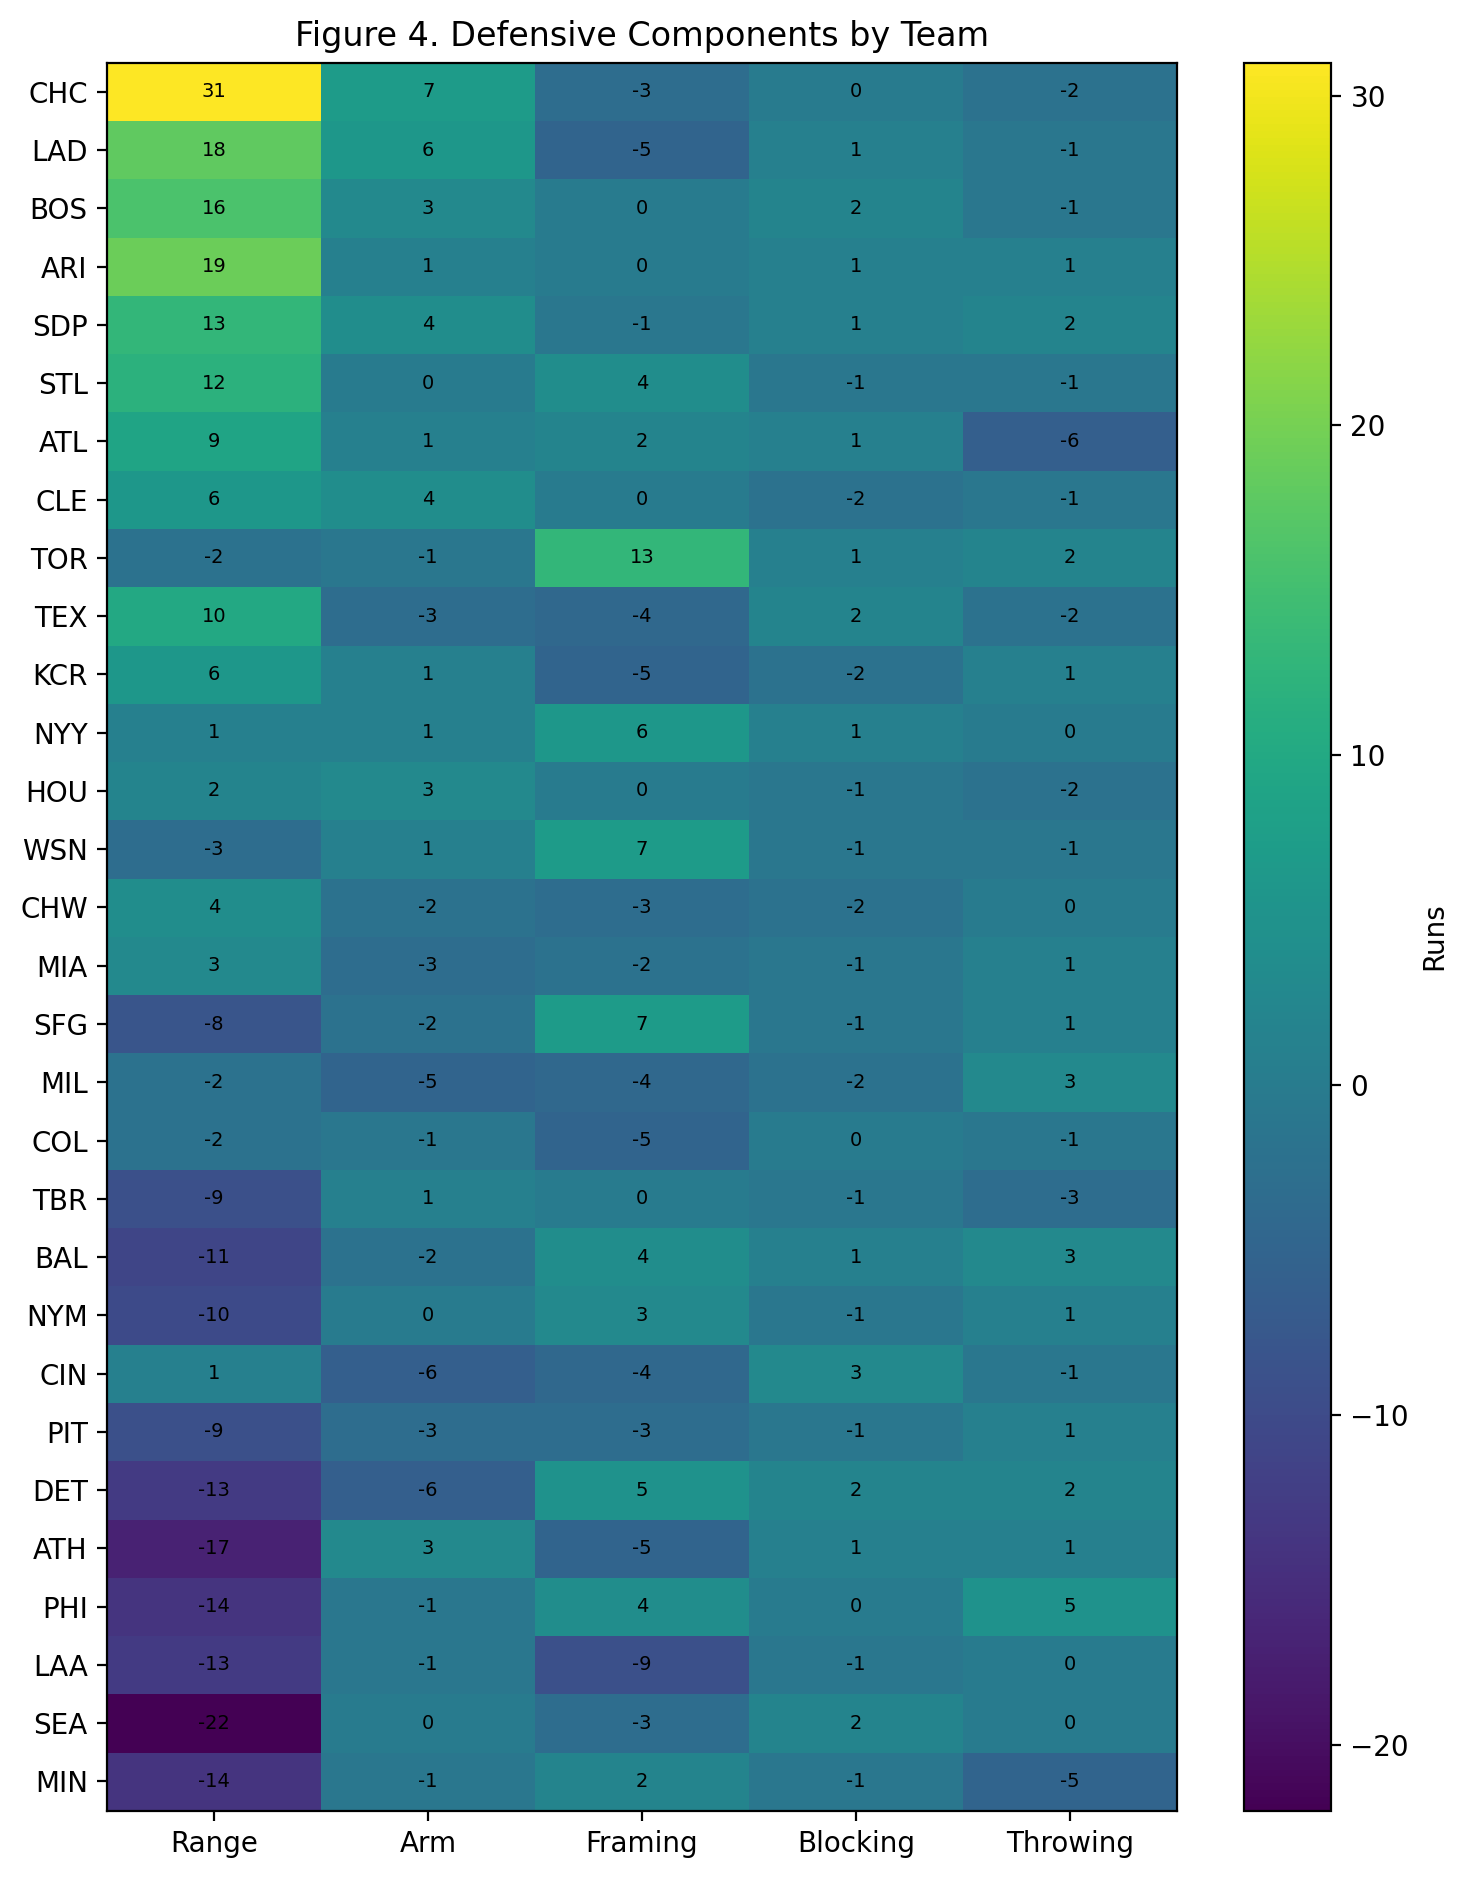
The Cubs Are Winning with Range
The component data explains why Chicago is separated from the rest of the league.
The Cubs have:
| Component | Value |
|---|---|
| Range | 31 |
| Arm | 7 |
| Framing | -3 |
| Blocking | 0 |
| Throwing | -2 |
| FRV | 34 |
That is the key to the whole study. Chicago is not leading because of framing. It is not leading because of blocking. It is leading because of range.
Range is the largest component in the dataset. The Cubs have a Range value of 31. The next highest teams are Arizona at 19, the Dodgers at 18, Boston at 16, and San Diego at 13. That gap is enormous. It suggests that Chicago is turning a large number of balls in play into outs that an average defense might not convert.
A simple component model is:
\mathrm{FRV}_i = \mathrm{Range}_i + \mathrm{Arm}_i + \mathrm{Framing}_i + \mathrm{Blocking}_i + \mathrm{Throwing}_i + \epsilon_iThe additional term at the end of the equation: (\epsilon_i)is included because published component totals may not always sum perfectly to the displayed total due to rounding, classification, or metric construction. But the practical interpretation is still clear. In this dataset, Range is the dominant separating variable.
Arizona is similar to Chicago in shape, though not in magnitude. The Diamondbacks have 19 Range and 23 FRV. The Dodgers combine 18 Range with 6 Arm. Boston combines 16 Range, 3 Arm, and 2 Blocking. San Diego has a more balanced profile, with 13 Range, 4 Arm, and positive throwing value.
Toronto is the most interesting contrast. The Blue Jays have a strong FRV total of 12, but they do not get it from range. Their Range value is -2. Their Framing value is 13. Toronto is a reminder that not all good defenses are built the same way. Some teams prevent runs by reaching more balls. Others gain value through catcher receiving. A single defensive ranking can hide those differences.
Traditional Fielding Stats Still Miss the Heart of Defense
Fielding percentage remains familiar, but it is not enough.
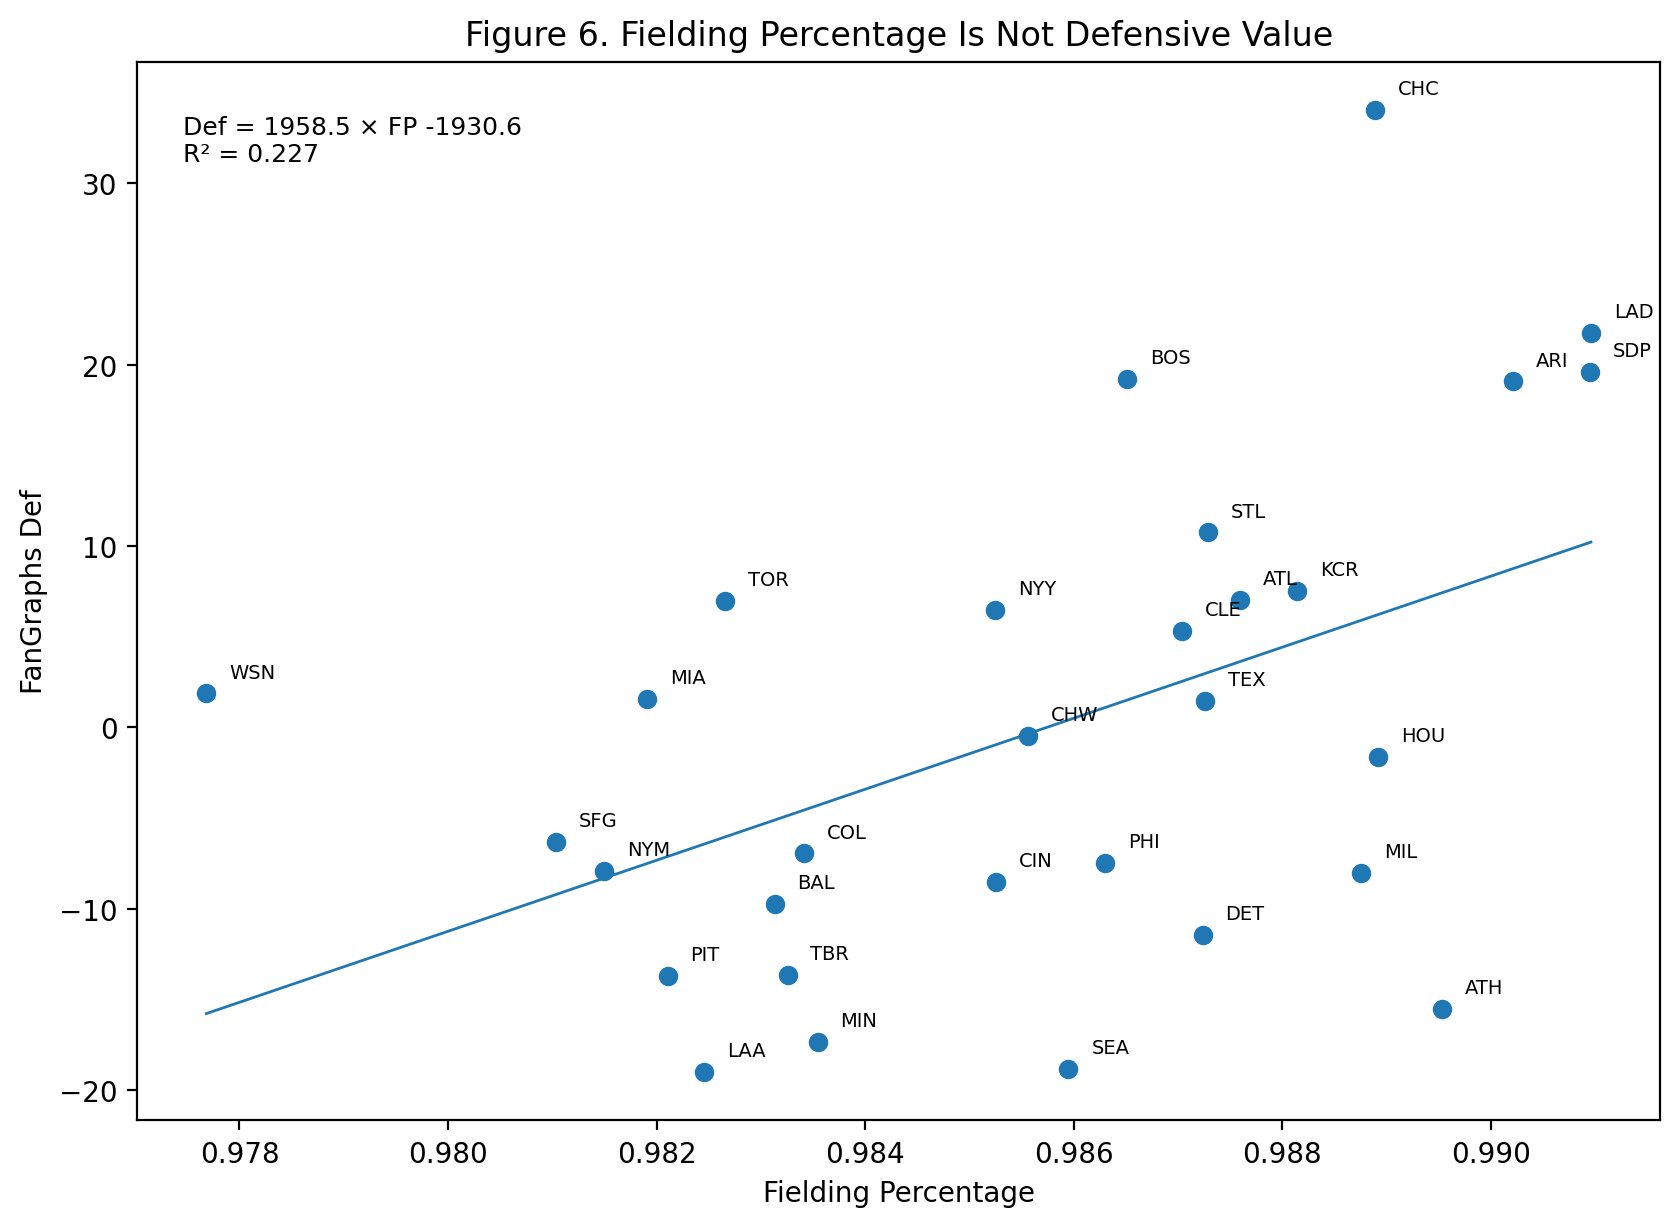
The regression between fielding percentage and FanGraphs Def is:
\mathrm{Def}_i = 1958.5 \cdot \mathrm{FP}_i - 1930.6with:
R^2 = 0.227That means that fielding percentage explains only about 23% of the variation in FanGraphs Def in this dataset.
This should not be surprising. Fielding percentage is calculated as:
\mathrm{FP} = \frac{\mathrm{PO} + \mathrm{A}} {\mathrm{PO} + \mathrm{A} + \mathrm{E}}Putouts and assists are important, as are errors. But this formula has a blind spot. It only evaluates plays that become official chances. It does not ask how many difficult balls were reached. It does not ask whether a fielder’s first step turned a hit into an out. It does not measure the value of positioning. It does not capture the difference between a clean single and a ball that a better defense would have converted into an out.
This is why a team can have a decent fielding percentage and still grade poorly by modern defensive metrics. Avoiding errors is not the same thing as preventing hits. Completing routine plays is not the same thing as creating outs.
The traditional fielding formula is useful, but incomplete. It measures reliability on contacted chances. Modern defensive metrics try to measure territory, difficulty, and run value.
What the Rankings Mean
The strongest defensive teams so far fall into three groups.
The first group is Chicago alone. The Cubs are the best team in the study because they combine elite OAA, elite FRV, elite FanGraphs Def, and excellent DRS. Their defense is driven by range, and the size of that range advantage is the most important finding in the data.
The second group includes the Dodgers, Red Sox, Diamondbacks, Padres, and Cardinals. These teams are all meaningfully above average. The Dodgers have the strongest DRS figure and excellent marks across the board. Arizona and San Diego are especially strong in FRV. Boston is balanced and rates highly in all major measures. St. Louis is not quite as strong by FanGraphs Def, but its OAA and FRV remain impressive.
The third group is more complicated. Atlanta, Cleveland, Toronto, Texas, Kansas City, and the Yankees all have positive composite scores, but each has a different profile. Toronto is especially noteworthy because its positive value comes primarily from framing rather than range. Texas has positive OAA but neutral FRV, which keeps its composite score closer to the middle.
At the bottom, Minnesota is the weakest team overall. Seattle and the Angels are also poor by modern defensive value. Philadelphia is unusual because DRS dislikes it more than FRV does, while the Athletics are consistently weak across several measures.
Why This is Important
Defense affects the interpretation of everything else.
A pitcher on a great defensive team is not working in the same environment as a pitcher on a poor defensive team. A staff backed by Chicago’s range advantage may see more balls converted into outs. A staff backed by a weak range defense may see more balls fall in, even when contact quality is similar. That matters when evaluating ERA, run prevention, pitcher luck, and even team overperformance.
The same is true for team analysis. A club with strong pitching numbers may be getting help from its defense. A club with disappointing run prevention may have a fielding problem hidden underneath the pitching line. Defense is not just a separate category. It is part of the context in which pitching statistics are produced.
This is especially important because modern baseball produces so many batted-ball measurements. We can now ask not just whether a ball was caught, but whether it should have been caught. We can compare actual outs to expected outs. We can separate the routine from the exceptional. That changes the language of defense.
Errors used to dominate the conversation because they were visible. Range is harder to see, but it is often more important.
Conclusion
So far this season, the defensive story is clear at the top. The Cubs have been the best defensive team in baseball by the combined evidence of DRS, OAA, FRV, and FanGraphs Def. Their advantage is not cosmetic. It is large, broad, and especially driven by range.
The Dodgers are also excellent, and they lead in DRS. Boston, Arizona, San Diego, and St. Louis form a strong second tier. At the bottom, Minnesota, Seattle, the Angels, Philadelphia, and the Athletics have been the weakest defensive teams by the composite measure.
But the broader lesson is methodological. Defense should not be reduced to one statistic. OAA, FRV, and FanGraphs Def are closely aligned. DRS is related but more independent. Fielding percentage captures a small part of the picture, but it misses much of what makes modern defense valuable.
The old defensive question was: did the fielder make an error?
The better question is: how many outs did the defense create that an average defense would not have created?
That is where the Cubs separate themselves. Not merely by being clean. By getting to the baseball.