After building offensive dominance rankings for each position, I wanted to ask a different question.
Not who had the greatest offensive career.
Not who had the greatest peak.
Not who won each position.
Instead:
What were the most dominant individual offensive seasons ever, relative to positional peers?
That last phrase matters. This is not a raw OPS list. It is not a WAR list. It is not a home-run list. It is a peer-adjusted positional dominance list.
A catcher is compared to catchers.
A shortstop is compared to shortstops.
A left fielder is compared to left fielders.
A first baseman is compared to first basemen.
The question is not simply: who had the biggest numbers?
The question is sharper:
Which seasons most disrupted the normal offensive expectations of a player’s position?
Methodology
For each position, I used the same framework from the earlier studies.
A player-season qualified if the player met the position requirement and the playing-time requirement:
At least 50 games at the position
At least 300 plate appearances
Then I calculated six offensive measures:
OBP
SLG
HR per PA
BB per PA
Runs per PA
RBI per PA
Each category was converted into a z-score within that season’s positional peer group. The season score was the sum of those six z-scores.
Season Score =
OBP z + SLG z + HR/PA z + BB/PA z + R/PA z + RBI/PA z
The result is a measure of offensive separation.
A first baseman must beat other first basemen.
A center fielder must beat other center fielders.
A second baseman must beat other second basemen.
That makes the results more interesting than a traditional leaderboard.
Figure 1: Top 25 Individual Offensive Seasons
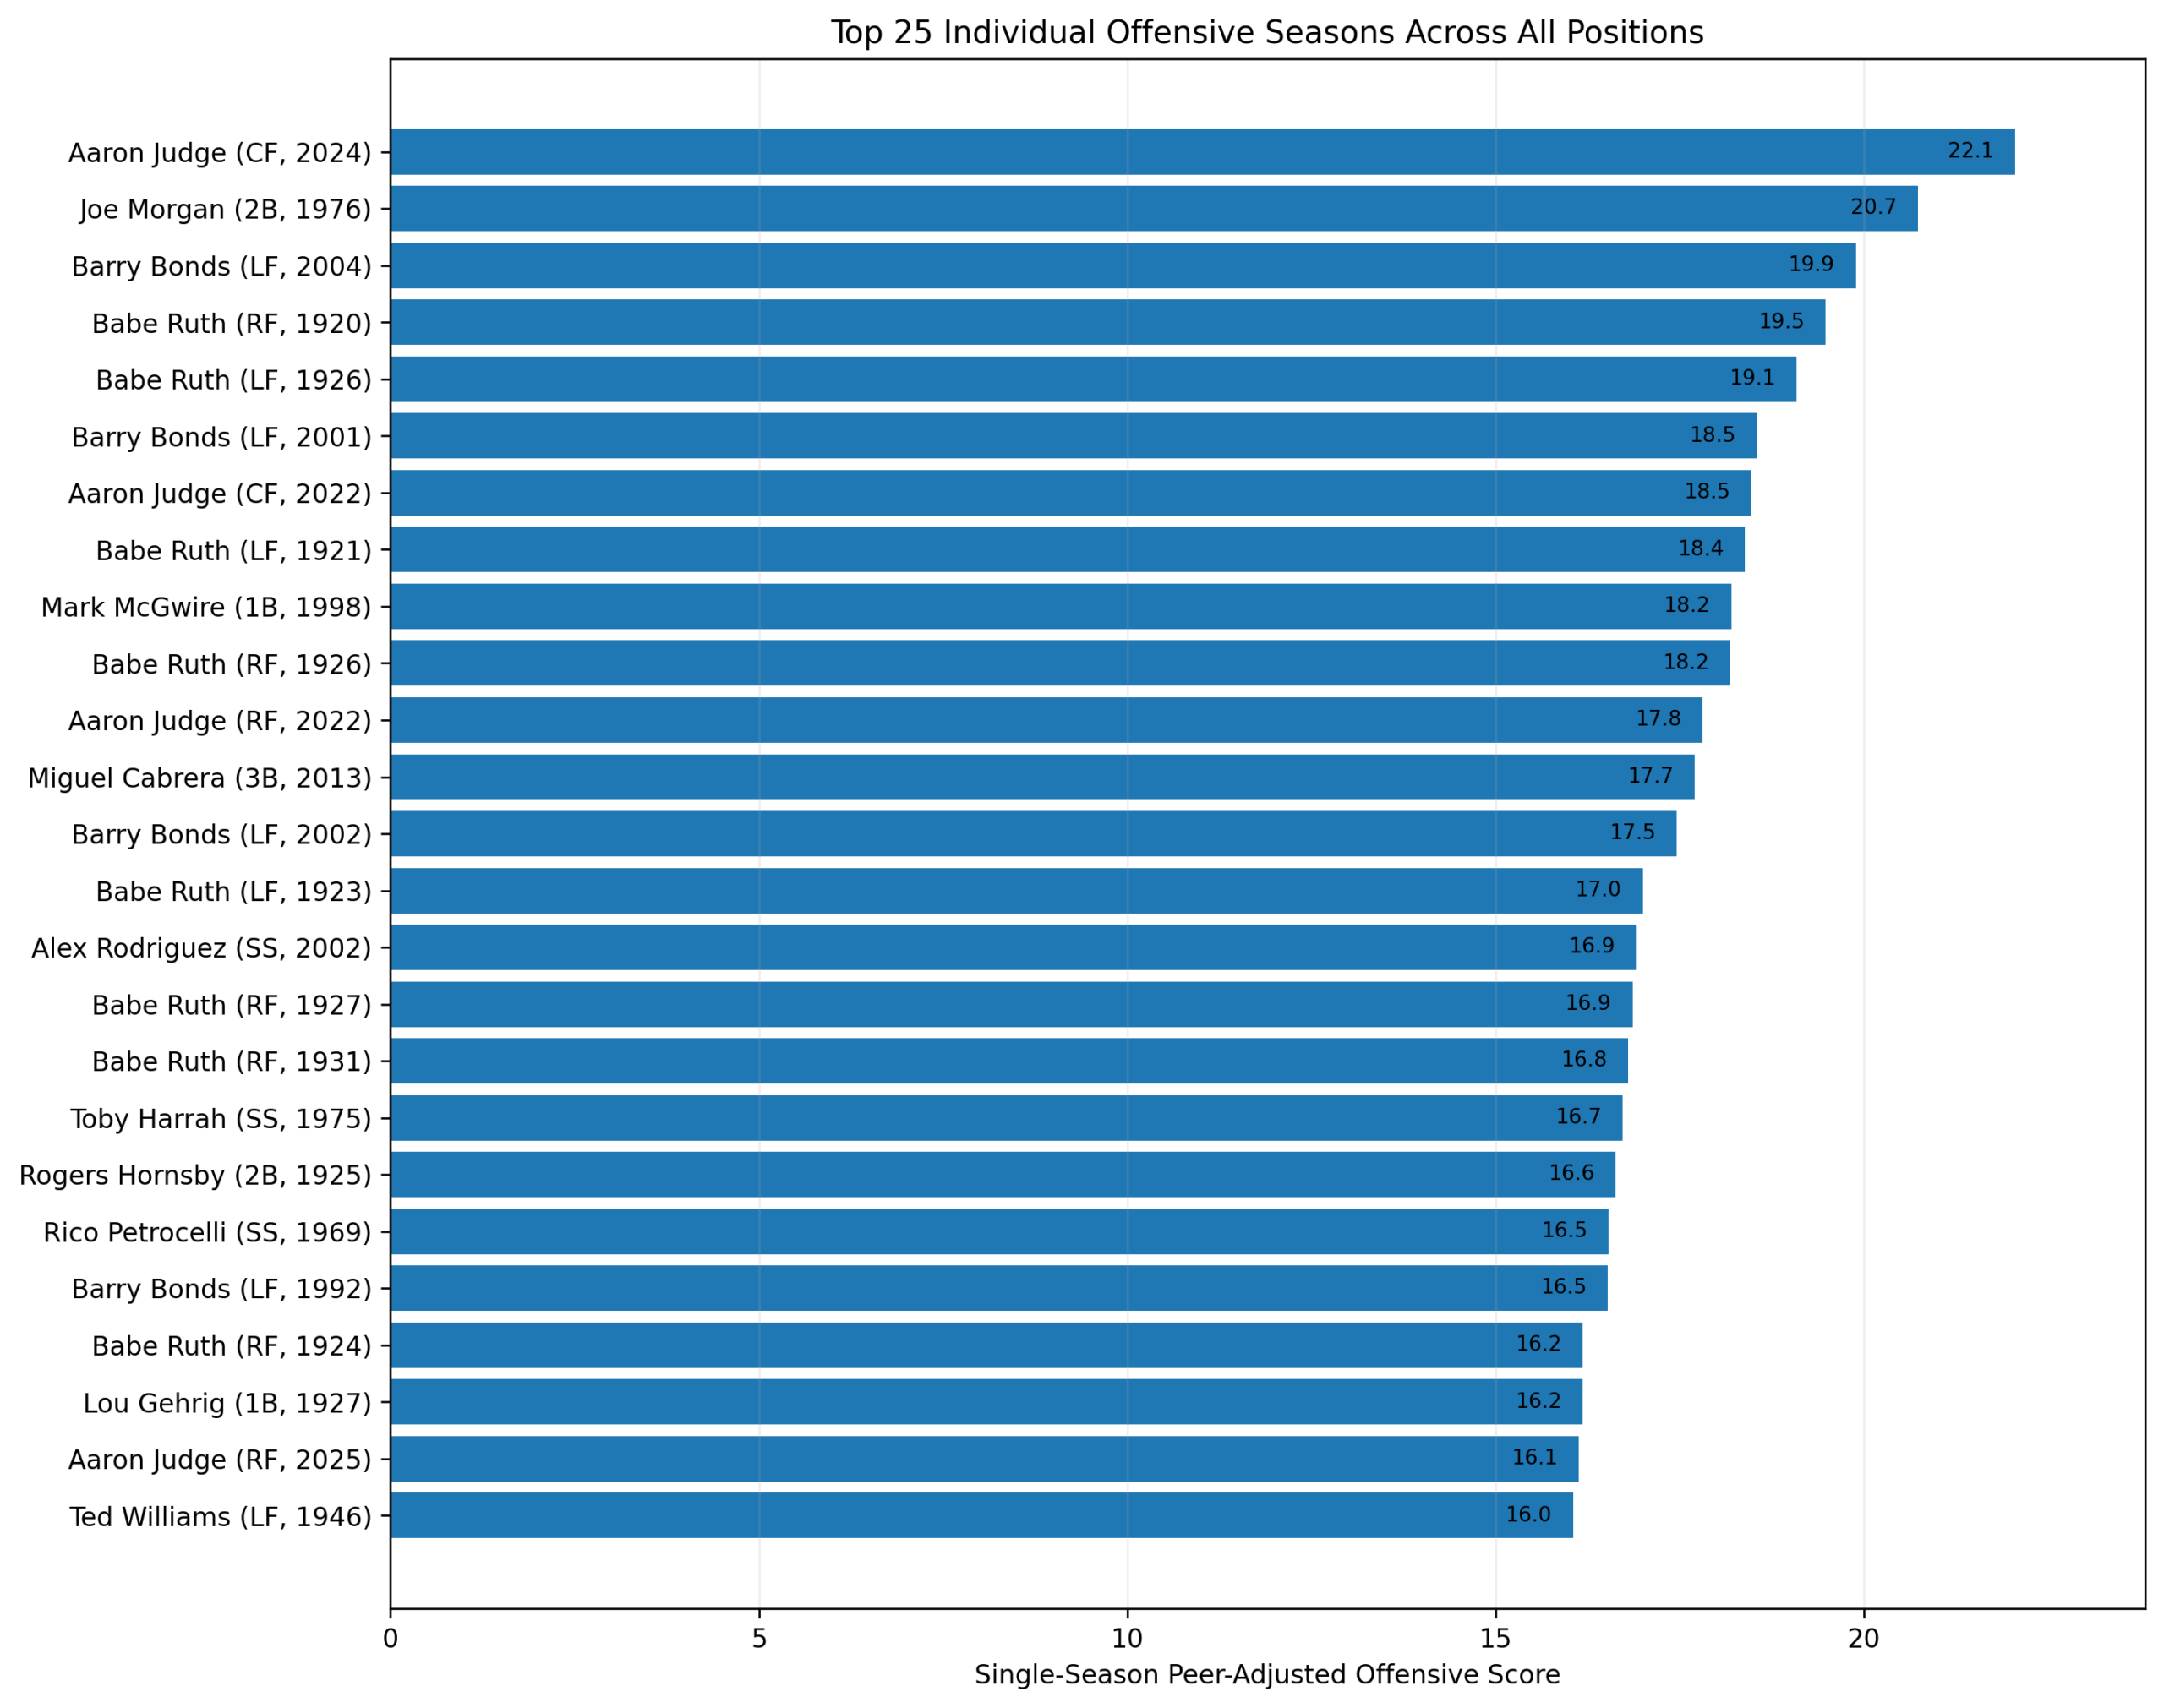
The top season in the entire study is Aaron Judge’s 2024 center-field season, with a score of 22.1.
That is a striking result. Judge’s 2024 season was not merely great. It was positionally explosive. Measured against other center fielders in that season, his combination of on-base ability, slugging, home-run rate, run scoring, and RBI production created the largest single-season separation in the entire dataset.
Second is Joe Morgan’s 1976 season at second base, with a score of 20.7. This may be the most important confirmation of the entire project. Morgan’s career dominance at second base was already surprising to some readers, but this individual-season chart shows that his case was not built only through accumulation. His 1976 season was one of the greatest peer-adjusted offensive seasons at any position.
Third is Barry Bonds in 2004, with a score of 19.9. That season is almost impossible to describe without sounding exaggerated. Bonds reached base at a level that broke ordinary baseball categories. The model captures that because his walk rate and OBP separation were overwhelming.
Fourth is Babe Ruth in 1920 as a right fielder, followed by Babe Ruth in 1926 as a left fielder. Ruth appears repeatedly because his career crossed positional categories, and because his dominance followed him. Whether classified in right field or left field, his best seasons remain among the most extreme in the study.
The top five are:
| Rank | Player | Position | Year | Score |
| 1 | Aaron Judge | CF | 2024 | 22.1 |
| 2 | Joe Morgan | 2B | 1976 | 20.7 |
| 3 | Barry Bonds | LF | 2004 | 19.9 |
| 4 | Babe Ruth | RF | 1920 | 19.5 |
| 5 | Babe Ruth | LF | 1926 | 19.1 |
That is a fascinating list because it crosses eras, positions, and offensive styles.
Judge represents the modern power-and-patience center fielder.
Morgan represents the complete second-base offensive season.
Bonds represents the extreme on-base/walk-rate outlier.
Ruth represents the original power revolution.
Different shapes. Same result: positional disruption.
Judge at the Top
Aaron Judge’s 2024 season ranking first may surprise some readers, but it makes sense within the model.
The key is positional context. Judge was not being compared to first basemen or corner outfielders. He was being compared to center fielders. That makes the separation larger.
His 2024 line in the model:
Position: CF
OBP: .458
SLG: .701
OPS: 1.159
HR: 58
BB: 133
R: 122
RBI: 144
PA: 703
Season Score: 22.1
Those are massive numbers at any position. At center field, they become almost absurd.
This does not mean Judge is the greatest center fielder ever. He does not have the career volume of Willie Mays, Mickey Mantle, Ken Griffey Jr., Ty Cobb, or Mike Trout. But in single-season terms, the model says his 2024 campaign was the largest positional offensive rupture in the study.
That is an important distinction.
Career greatness and single-season dominance are not the same thing.
Morgan’s 1976 Season Looks Even Better
Joe Morgan’s 1976 season ranking second overall is perhaps the most satisfying result.
Morgan’s second-base study already showed him beating Rogers Hornsby by this peer-adjusted framework. That raised an obvious question: was Morgan winning because of career structure, walks, and era adjustment, or did he truly have elite individual seasons?
This figure answers that.
Morgan’s 1976 season was not just great for a second baseman. It was one of the greatest offensive seasons at any position relative to peers.
His score of 20.7 ranks ahead of Bonds 2004, Ruth 1920, Ruth 1926, Bonds 2001, Judge 2022, and McGwire 1998.
That does not mean Morgan was a better raw hitter than Ruth or Bonds. It means his 1976 offensive profile separated from the second-base baseline to an extraordinary degree.
This is the value of the method. It lets a season like Morgan 1976 stand next to the more famous power seasons and hold its own.
Bonds and Ruth Still Dominate the Historical Imagination
Bonds and Ruth appear throughout the top 25.
Bonds appears with:
2004 LF
2001 LF
2002 LF
1992 LF
Ruth appears with:
1920 RF
1926 LF
1921 LF
1926 RF
1923 LF
1927 RF
1931 RF
1924 RF
That repetition is substantial and incredible.
A single appearance can be an outlier. Repeated appearances suggest a player occupied the outer edge of offensive possibility more than once.
Ruth’s seasons represent the early power revolution. His combination of home runs, walks, slugging, and run production was unlike anything his peers were doing.
Bonds’s seasons represent a later, stranger kind of offensive distortion. His walk totals were so extreme that ordinary run-production categories sometimes understate what was happening. Pitchers were not just failing to get him out. They were often refusing to let him participate normally.
The model treats both as forms of dominance.
McGwire, Cabrera, A-Rod, and the Others
The top 25 also includes several important non-Ruth, non-Bonds seasons.
Mark McGwire’s 1998 first-base season ranks ninth, with a score of 18.2. That aligns with the first-base study, where McGwire owned the peak argument even though Lou Gehrig won the career and balanced case.
Miguel Cabrera’s 2013 third-base season ranks twelfth, with a score of 17.7. That is the highest third-base season in the combined top 25 and a reminder that Cabrera’s offensive peak at third base was enormous.
Alex Rodriguez’s 2002 shortstop season ranks fifteenth, with a score of 16.9. That fits the shortstop study perfectly. Honus Wagner wins the career argument, but Rodriguez owns the peak argument.
There are also wonderful surprises:
Toby Harrah, SS, 1975
Rico Petrocelli, SS, 1969
Rogers Hornsby, 2B, 1925
Yordan Alvarez, LF, 2022
These are the seasons that make a project like this worth doing. Some names are expected. Others emerge because the model is measuring separation from positional peers, not historical fame.
Figure 2: Which Positions Appear Most?
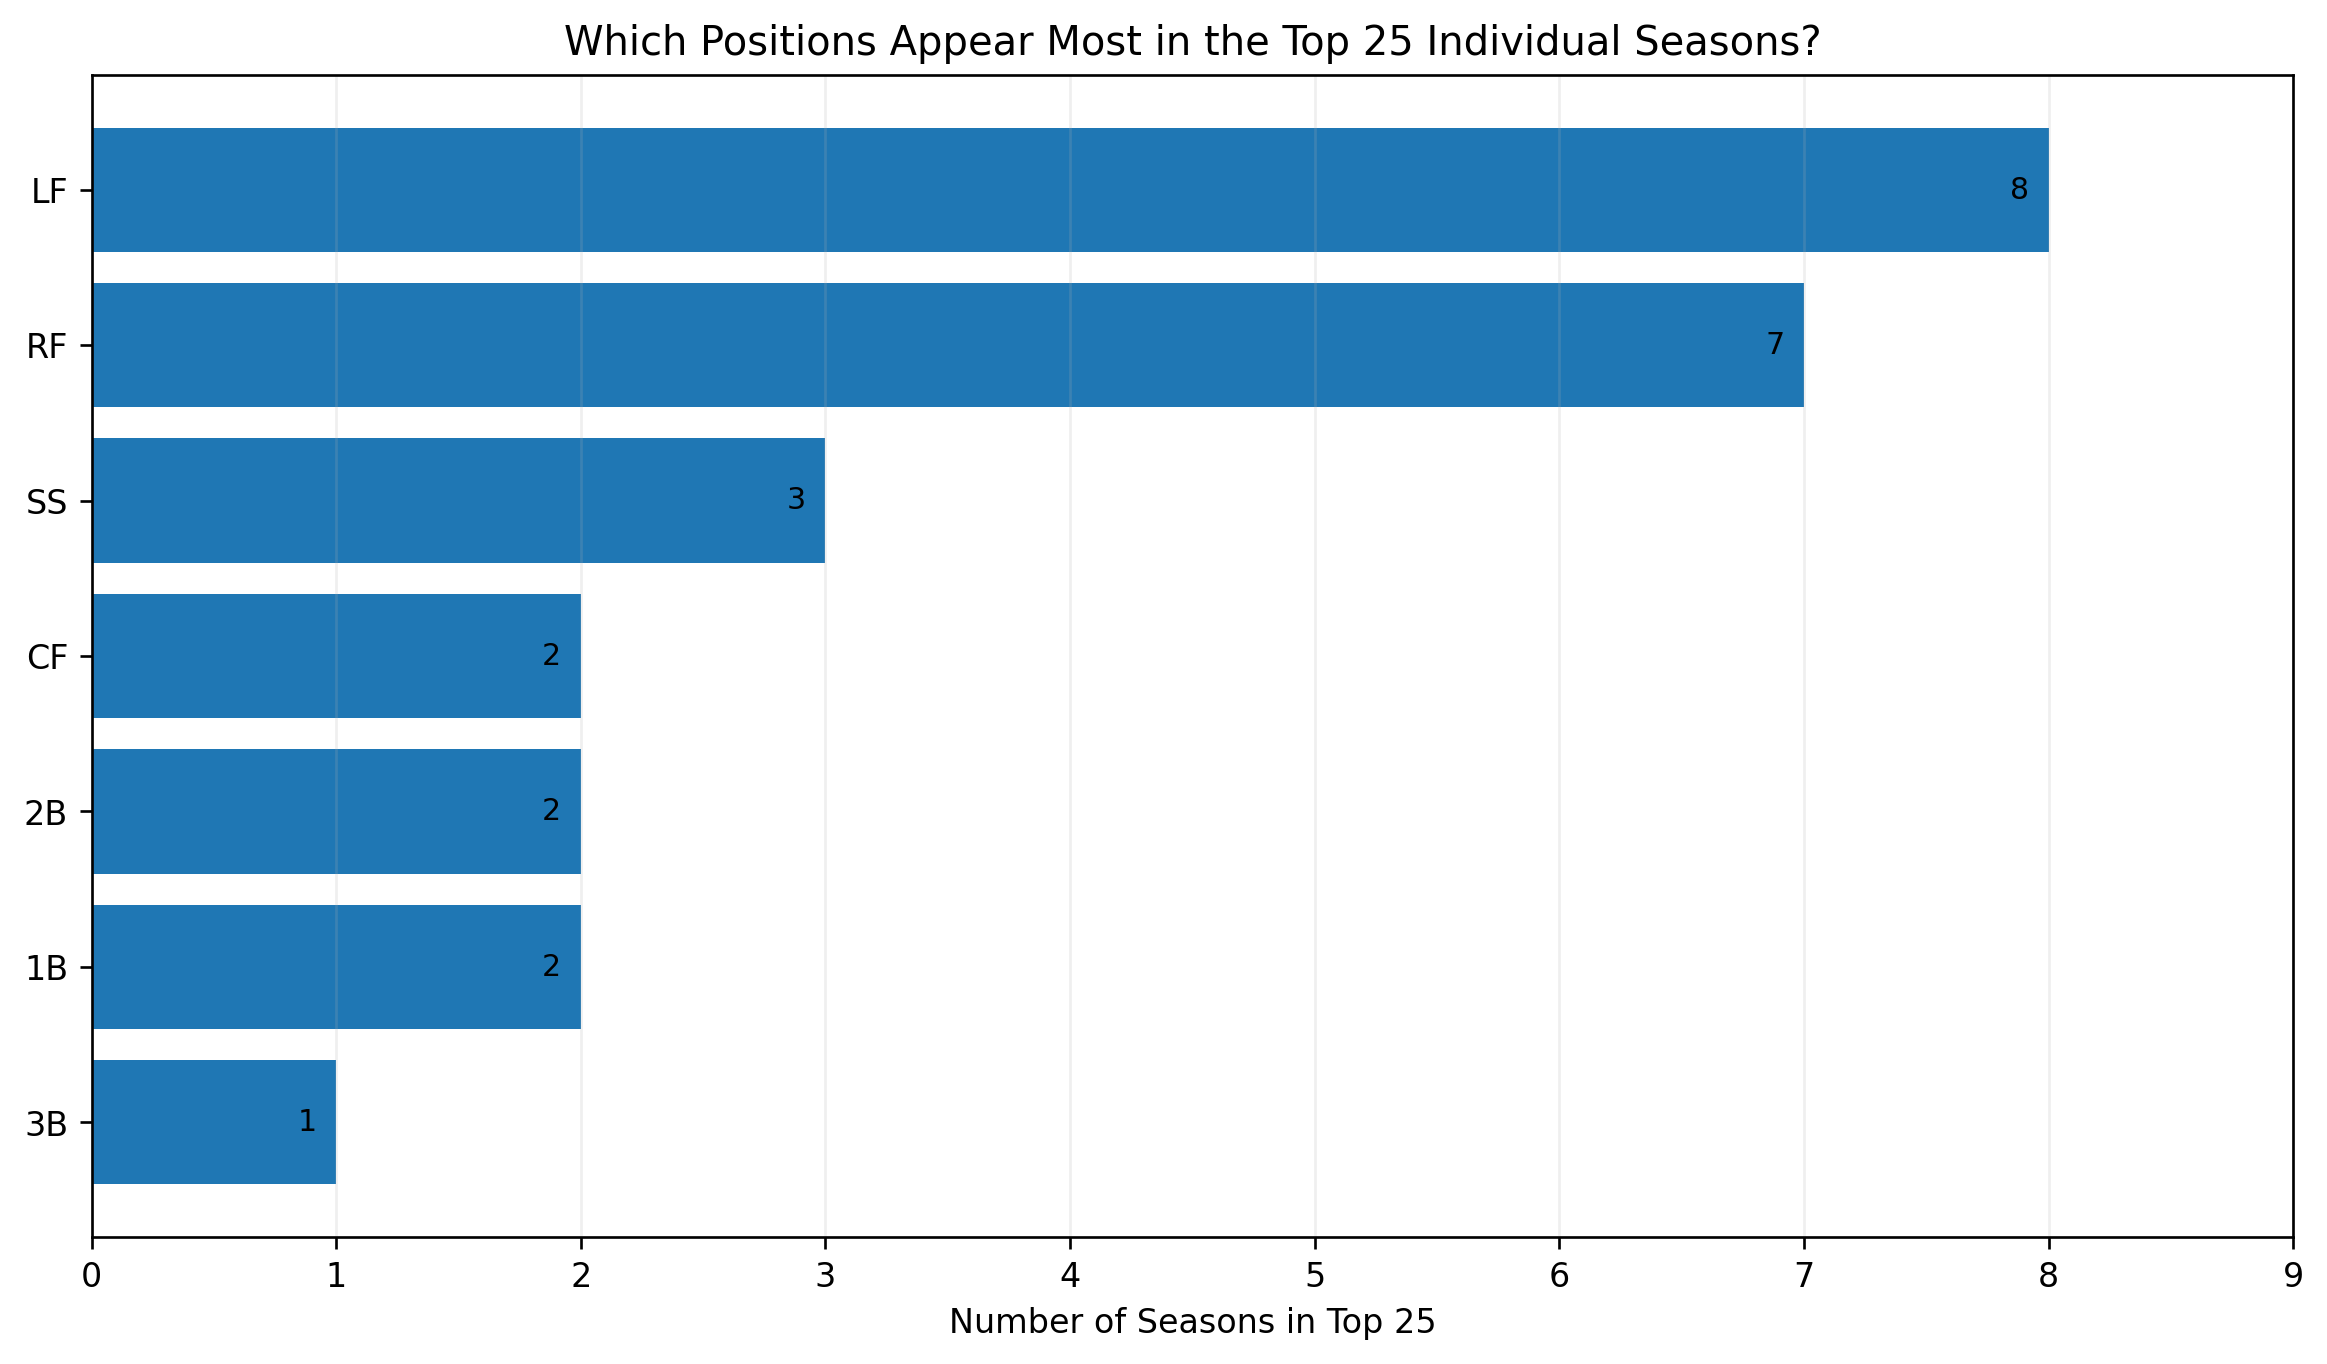
The position-count chart shows how unevenly the top 25 seasons are distributed.
Left field leads with 8 seasons. Right field follows with 7. Shortstop has 3. Center field, second base, and first base each have 2. Third base has 1. Catcher has 0.
That distribution is telling.
Left field and right field dominate the list because many of baseball’s most extreme offensive seasons came from corner outfielders: Bonds, Ruth, Williams, Judge as a right fielder, and others.
But the presence of shortstop, second base, and center field is especially meaningful. Those positions are not expected to produce the same offensive totals as corner outfield or first base. So when a player at one of those positions breaks through, the peer-adjusted score can become enormous.
That explains Morgan, A-Rod, Harrah, Petrocelli, and Judge.
The absence of catchers is also important. No catcher season appears in the top 25. That does not mean catcher offense is unimportant. It means the position is structurally different. The physical burden, playing-time limits, and offensive constraints make it much harder for a catcher season to reach the outer edge of the full-position distribution.
Cal Raleigh’s 2025 season led the catcher study, but it still did not reach the top 25 across all positions.
That is not a failure of Raleigh or catchers. It is evidence of the position’s difficulty.
The Results
This figure changes the way we think about single-season greatness.
A traditional list would likely be dominated by raw OPS, home runs, or WAR. That would tell us something useful, but it would miss positional disruption.
This model asks a different question:
How strange was this season for the position?
That is why Judge 2024 can rank first. A .701 slugging percentage and 58 home runs from a center fielder is not merely excellent. It is positionally destabilizing.
That is why Morgan 1976 ranks second. His season combined OBP, power, walks, run scoring, and RBI production at a position where that total offensive shape was rare.
That is why A-Rod 2002 matters. A 57-home-run shortstop season changes the offensive geometry of the position.
The best seasons are not merely high totals. They are seasons that make the positional baseline look obsolete.
The Main Findings
Several conclusions stand out.
First, Aaron Judge’s 2024 center-field season is the most dominant single offensive season in the study. That is not a career statement. It is a single-season positional statement.
Second, Joe Morgan’s 1976 season is one of the strongest findings in the entire project. It validates the second-base study and shows that Morgan’s offensive greatness was not just cumulative.
Third, Bonds and Ruth remain the repeated occupants of the extreme zone. Their seasons appear again and again because they repeatedly stretched offensive possibility.
Fourth, corner outfield dominates the top 25, but not completely. Shortstop, second base, center field, first base, and third base all place seasons on the list.
Fifth, catcher is absent, which reinforces the idea that catcher offense needs to be interpreted within its own constraints.
Conclusion
The top 25 individual seasons show offensive greatness in its most concentrated form.
Some seasons accumulate value.
Some seasons win awards.
Some seasons define careers.
A few seasons break the baseline.
That is what this list measures.
Judge in 2024. Morgan in 1976. Bonds in 2004. Ruth in 1920. McGwire in 1998. Cabrera in 2013. A-Rod in 2002. Hornsby in 1925.
These were not just great seasons. They were seasons that made their positional peer groups look ordinary.
And perhaps that is the central idea behind the entire series.
Greatness is not only how much a player produced.
It is how far he moved the boundary of what his position seemed capable of producing.
![]()