The earlier chapter asked a ranking question: which MLB organizations built the best pitching staffs from 2001 to 2025?
This post asks a slightly different question.
Which teams pitched alike?
That is not the same thing. Two teams can both be good without being similar. One team might dominate through strikeouts and fielding-independent indicators. Another might prevent runs through contact control, ground balls, park fit, or bullpen management. A third might have a mixed profile, with decent run prevention but weaker underlying indicators. Ranking tells us who was best. Clustering tells us who had the same shape.
That is why a dendrogram is useful. It does not begin with a leaderboard. It begins with resemblance.
The question becomes: if we describe each franchise by its long-term pitching profile, which franchises naturally group together?
The method
Each franchise was described using season-normalized pitching variables from 2001 through 2025. That step is important because pitching environments changed dramatically during this period. A 4.00 ERA in 2001 does not mean exactly the same thing as a 4.00 ERA in 2025.
So each team-season was first compared to its own season.
z_{i,y,m} = \frac{ X_{i,y,m} - \overline{X}_{y,m} }{ s_{y,m} }Here, (X_{i,y,m}) is team (i)’s value for metric (m) in season (y), (\bar{X}_{y,m}) is the league average for that metric in that season, and (s_{ym}) is the season standard deviation.
For lower-is-better metrics, such as ERA-, FIP-, xFIP-, SIERA, BB%, HR/9, HR/FB, and Hard%, I reversed the sign so that higher values always mean a more favorable pitching profile.
The clustering used these long-term franchise traits:
| Category | Variables |
|---|---|
| Value | WAR |
| Dominance | K-BB% |
| Command | BB% prevention |
| Run prevention | ERA- |
| Fielding-independent skill | FIP-, xFIP-, SIERA |
| Home-run control | HR/9, HR/FB |
| Contact profile | GB%, Hard% prevention |
| Starter usage | Quality-start rate |
After calculating each franchise’s average profile, I standardized the franchise-level variables and used Ward hierarchical clustering. The distance between teams is based on how far apart their standardized pitching profiles are.
d(i,j) = \sqrt{ \sum_{m=1}^{p} \left( z_{i,m} - z_{j,m} \right)^2 }The dendrogram then links the most similar teams first and gradually joins them into larger groups.
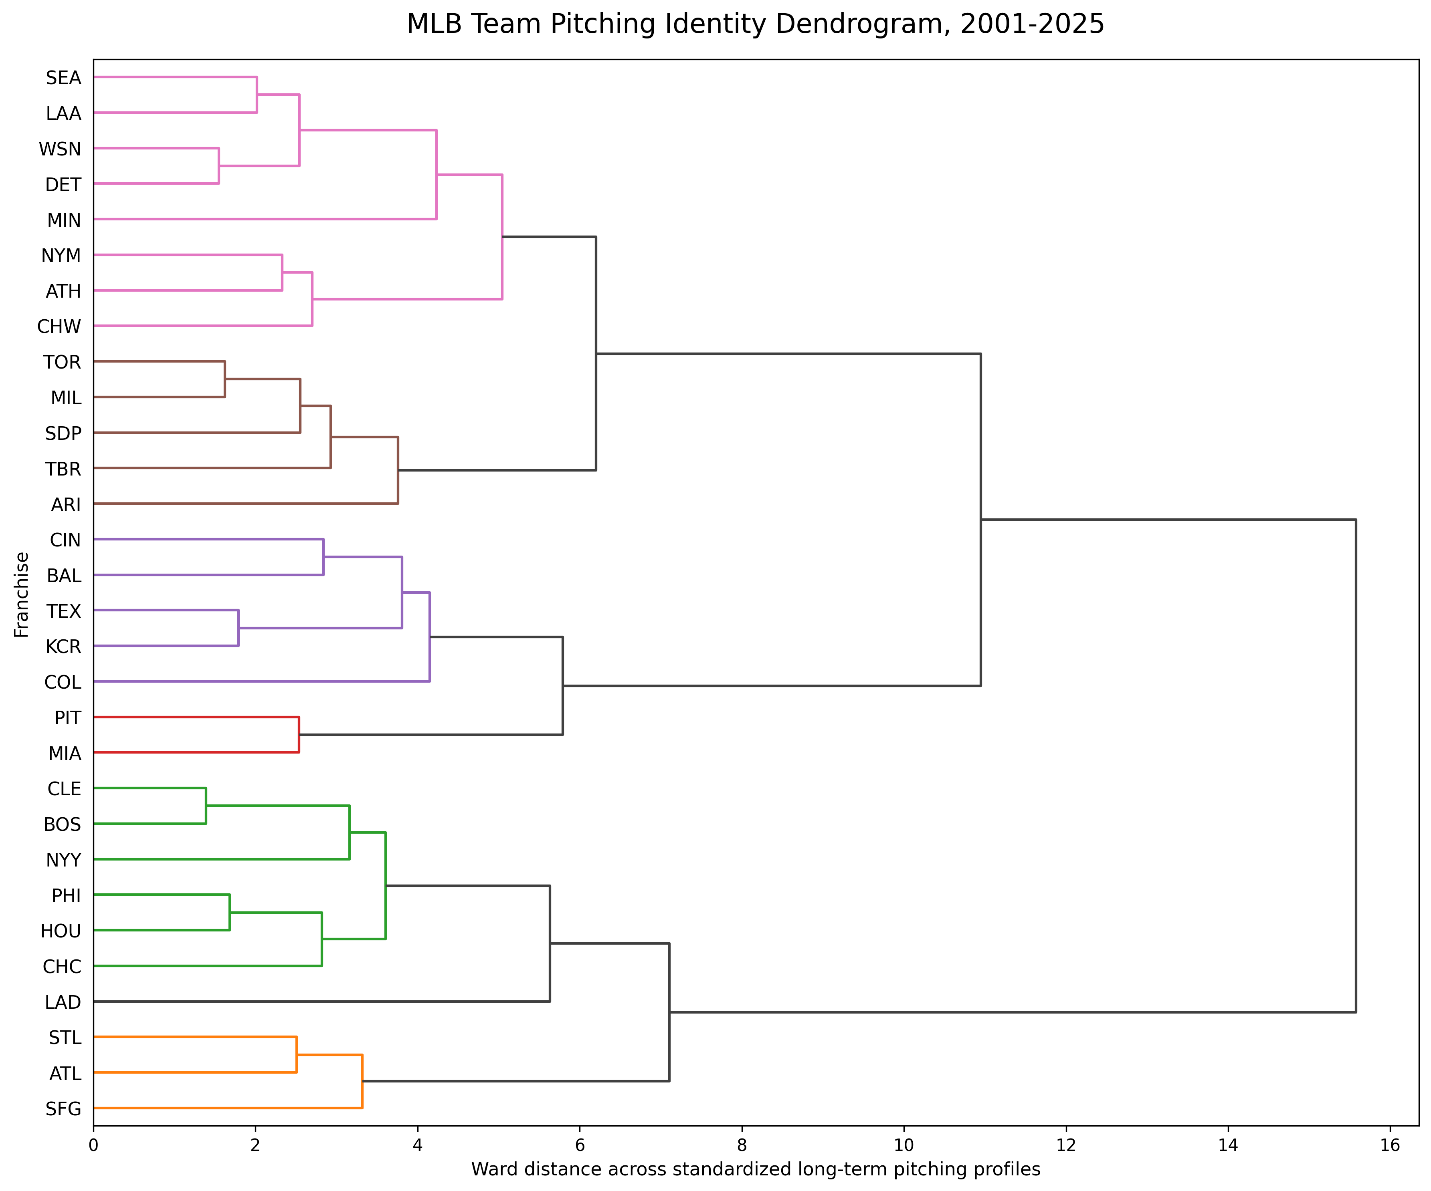
Figure 1. MLB team pitching identity dendrogram, 2001-2025
The first thing to notice is that the dendrogram is not only a quality ranking. It does separate many of the best pitching organizations, but it also captures style.
The Dodgers, Yankees, Astros, Guardians, Phillies, Cubs, and Red Sox form a major cluster. That makes sense. These organizations score well across the strongest modern pitching indicators: WAR, K-BB%, FIP-, xFIP-, and SIERA. This is the elite skill-and-value cluster.
But the Braves, Giants, and Cardinals form a different group. They are not grouped with the Dodgers and Yankees, even though they include strong pitching organizations. Their similarities lie more in run prevention, home-run suppression, ground-ball tendency, and contact management. In other words, their profile is not merely “good pitching.” It is a particular kind of good pitching.
The Rays, Brewers, Padres, Blue Jays, and Diamondbacks form another interesting group. This cluster is more modern and peripheral-driven. These teams tend to show some strength in strikeout-minus-walk skill and xFIP/SIERA-style indicators, but they are not as dominant in long-term value or run prevention as the elite group.
At the other end, the Rockies, Royals, Orioles, Reds, and Rangers group together as long-term struggling pitching profiles. That does not mean each franchise was bad every year. It means that across the full 2001-2025 window, their average profile shares several weaknesses: lower WAR, weaker K-BB%, weaker fielding-independent indicators, and poorer home-run prevention.
The six main clusters
The dendrogram produced six useful interpretive groups:
| Cluster | Teams | Interpretation |
|---|---|---|
| Elite skill and value staffs | BOS, CHC, CLE, HOU, LAD, NYY, PHI | Strongest overall skill profile, especially
WAR, K-BB%, FIP-, xFIP-, and SIERA |
| Contact-control run preventers | ATL, SFG, STL | Strong run prevention, home-run control,
ground-ball tendency, and starter length |
| Modern peripheral builders | ARI, MIL, SDP, TBR, TOR | Better in K-BB%, xFIP, and SIERA than
in long-term WAR or ERA dominance |
| Mixed middle profiles | ATH, CHW, DET, LAA, MIN, NYM, SEA, WSN | No single shared identity as strong as the
other groups, generally middle-range profiles |
| Low-dominance HR suppressors | MIA, PIT | Weak dominance indicators but relatively
better home-run suppression |
| Long-term struggling profiles | BAL, CIN, COL, KCR, TEX | Broadly weak long-term pitching profile across value, dominance, and fielding-independent metrics |
Why the clusters formed
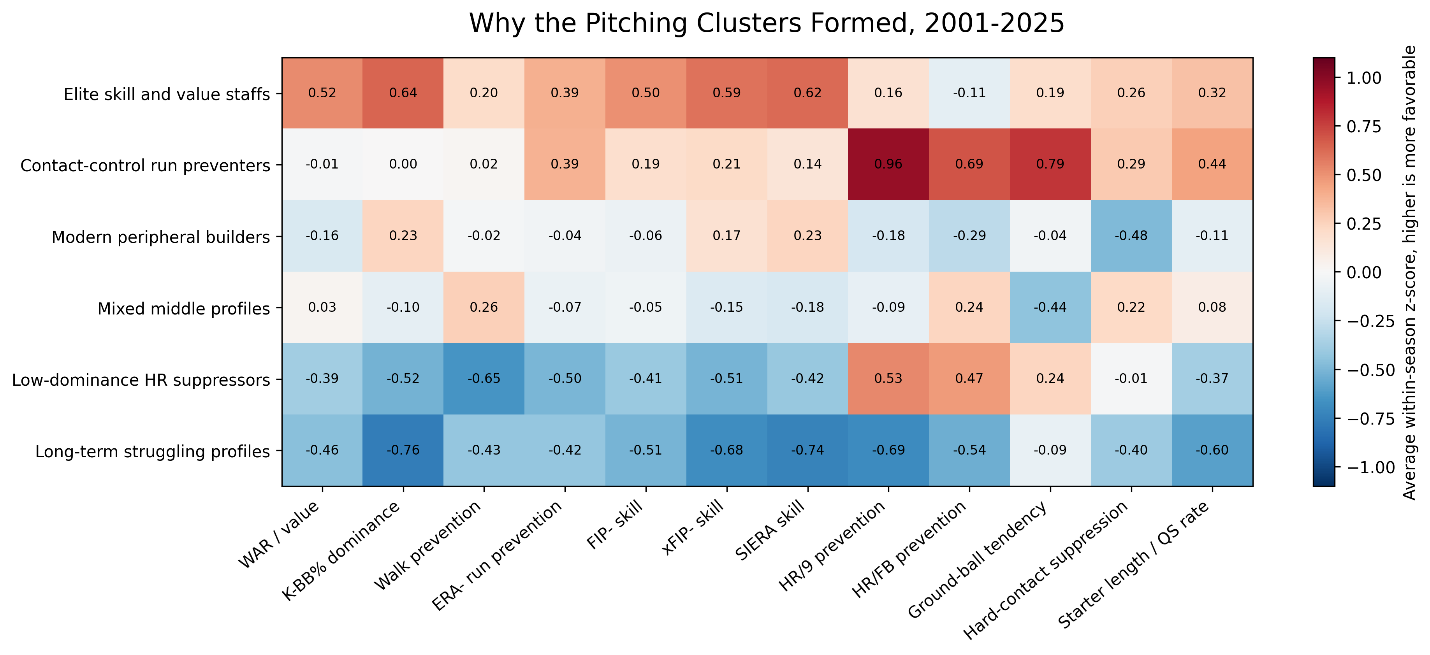
Figure 2 explains the dendrogram. It shows the average profile of each cluster.
The elite skill-and-value group is strong almost everywhere that modern pitching analysis would expect. The group is especially strong in K-BB%, FIP-, xFIP-, SIERA, and WAR. This is the clearest “modern excellence” cluster.
The contact-control group is different. Atlanta, San Francisco, and St. Louis are not grouped primarily because of overwhelming strikeout dominance. They cluster because of run prevention, home-run prevention, ground-ball tendency, and starter length. This is a more traditional-looking run-prevention cluster.
The modern peripheral group is subtle. Arizona, Milwaukee, San Diego, Tampa Bay, and Toronto do not dominate the long-term value category. Still, they show enough similarity in strikeout-minus-walk skill and advanced indicators to cluster together. This feels like a group of organizations that, at different times, leaned into modern pitching design without producing the same full-period dominance as the Dodgers or Yankees.
The struggling group is also clear. Baltimore, Cincinnati, Colorado, Kansas City, and Texas sit below average in most of the key categories. Colorado’s presence is not surprising because pitching in Denver creates a unique environmental problem. But the dendrogram is not only about park effects. The broader cluster reflects weaker long-term skill indicators too.
Why the Dodgers separate
The Dodgers are inside the elite skill-and-value cluster, but they remain visually distinctive. They join the group later than several other teams inside that cluster. That is important.
It suggests that the Dodgers are similar to other elite pitching organizations but are still somewhat their own thing. Their long-term profile is so strong across so many categories that they are not simply interchangeable with the Yankees, Astros, Guardians, Phillies, Cubs, or Red Sox.
That matches the earlier chapter. The Dodgers were the top pitching organization by average normalized score from 2001 to 2025. The dendrogram confirms the same story from a different angle. They are not only highly ranked. They have a recognizable organizational profile.
Houston and Cleveland as development stories
Houston and Cleveland are also revealing.
The Astros cluster with the elite organizations, but their full-period story contains more transformation than the Dodgers’ story. Houston’s early-2010s pitching collapse and late-2010s pitching rise are both part of the same 25-year average. Even with those bad seasons included, Houston still clusters with the strongest pitching organizations. That says something about how powerful the later Houston pitching model became.
Cleveland’s placement also makes sense. The Guardians are not always discussed like the Dodgers or Yankees because they operate with a different market profile, but the data places them in the same broad pitching family. Their identity is built around development, strike-zone control, and repeatable pitching skill.
Tampa Bay, Milwaukee, and the modern middle
The Rays and Brewers are especially interesting because they appear in the modern peripheral group rather than the elite skill-and-value group.
That is not an insult. It may actually be the more interesting result.
Tampa Bay and Milwaukee often represent modern pitching creativity: bullpen flexibility, role adaptation, pitcher development, and tactical staff construction. But over the full 25-year period, the dendrogram places them closer to San Diego, Toronto, and Arizona than to the Dodgers or Yankees.
That suggests a distinction between modernity and dominance. A team can be tactically modern without producing the same long-term value profile as the very top organizations.
What the dendrogram adds
The dendrogram adds something that a leaderboard cannot.
A leaderboard says:
The Dodgers were first.
The Yankees were second.
The Astros, Guardians, Cubs, Red Sox, Phillies, and Braves followed.
The dendrogram says something different:
The Dodgers, Yankees, Astros, Guardians, Cubs, Red Sox, and Phillies belong to a shared skill-and-value family.
The Braves, Giants, and Cardinals form a separate contact-control and run-prevention family.
The Rays, Brewers, Padres, Blue Jays, and Diamondbacks form a modern peripheral family.
The Rockies, Royals, Orioles, Reds, and Rangers share a long-term struggling profile.
That is the value of clustering. It changes the question from “who was better?” to “who was built alike?”
Conclusion
The central lesson is that pitching identity has shape.
Some organizations built strong staffs across nearly every modern indicator. Some built staffs that prevented runs through contact management and home-run control. Some had modern peripheral strengths without the same long-term value profile. Some struggled across nearly every measure.
The dendrogram does not replace the chapter’s rankings. It deepens them.
From 2001 to 2025, the best pitching organizations were not merely collecting arms. They were building systems. The Dodgers built the most consistent system. The Yankees, Astros, Guardians, Phillies, Cubs, and Red Sox clustered near them because they also produced strong long-term skill profiles. The Braves, Giants, and Cardinals showed a different path, one built more around run prevention and contact control.
The larger point is simple: team pitching is not just performance. It is identity.
And the dendrogram shows us how identity takes shape.