The shortstop position in the 1970s was very different from what we know today. Power was welcome, of course, but it was hardly the defining requirement. Teams generally expected their shortstops to catch the ball, make the throw, turn the double play, move runners when necessary, and contribute enough offensively to keep the lineup moving.
That makes the decade particularly interesting to study. There was no Cal Ripken Jr. yet, no Alex Rodriguez, no Derek Jeter, and certainly no modern collection of 25-home-run shortstops scattered throughout the league. The position still leaned heavily toward defense, speed, contact, and durability.
But who was actually the best?
The familiar names arrive quickly. Dave Concepción was the shortstop of the Big Red Machine. Mark Belanger was one of the most celebrated defensive players of his generation. Bert Campaneris brought speed and range to the Oakland dynasty. Larry Bowa became synonymous with Philadelphia baseball. Chris Speier, Don Kessinger, Freddie Patek, Rick Burleson, Toby Harrah, and others all made substantial claims of their own.
Rather than begin with reputation, I wanted to begin with the data. The result was clear at the top. The more interesting story, however, was what happened immediately behind the winner.
Defining a 1970s Shortstop
The study covers the seasons from 1970 through 1979. Players were identified by their appearances at shortstop, and the primary requirement was at least three qualifying shortstop seasons during the decade.
That qualification matters. A player who happened to spend one excellent season at shortstop should not necessarily outrank someone who occupied the position for most of the decade. At the same time, requiring eight or ten seasons would unfairly eliminate players whose careers began midway through the 1970s.
The three-season minimum produced a pool of 34 shortstops. As a sensitivity check, I later tightened the requirement to five qualifying seasons. The top five did not change, which matters when we consider how robust the final ranking really is.
The offensive model follows the same peer-adjusted Model C framework I have used in earlier positional studies. Each shortstop is compared with other shortstops from his own season rather than with hitters from another position or another era. The underlying model incorporates on-base percentage, isolated power, walk rate, strikeout avoidance, baserunning, runs scored, and RBI production.
For WordPress, the equation is:
\begin{aligned} \mathrm{OffensiveScore} &= z_{\mathrm{OBP}} + z_{\mathrm{ISO}} + z_{\mathrm{BB/PA}} + z_{\mathrm{LowSO/PA}} \\ &\quad + z_{\mathrm{NetSB/PA}} + z_{\mathrm{R/PA}} + z_{\mathrm{RBI/PA}} \end{aligned}This approach changes the question in an important way. It does not ask whether Freddie Patek hit like a first baseman. He obviously did not. It asks how much offensive value Patek produced relative to the other men being asked to play shortstop at the same time.
Defense presents a more difficult problem.
The Lahman database gives us traditional fielding information, including assists, putouts, double plays, errors, games, and fielding percentage. It cannot provide the spatial information available in modern systems such as Outs Above Average, nor can it fully separate a shortstop from the pitchers, second basemen, field conditions, positioning, and scoring practices around him.
Still, we can construct a useful traditional defensive index:
\mathrm{TraditionalDefensiveScore} = z_{\mathrm{A/G}} + z_{\mathrm{PO/G}} + z_{\mathrm{DP/G}} + z_{\mathrm{FPct}} + z_{\mathrm{LowE/G}}This is the same general traditional-defense construction used in our earlier positional work. It should be interpreted as a measure of performance in the defensive statistics available to us, not as a retroactive version of modern defensive runs saved.
Once the offensive and defensive dimensions were calculated, each was standardized and combined:
\mathrm{TwoWayScore}_{i} = z_{\mathrm{Offense},i} + z_{\mathrm{Defense},i}That is the key to the study. We are not looking for the best hitter who happened to stand at shortstop, nor simply for the slickest glove. We are looking for the player who best combined the position’s two demands.
The First Answer
The ranking produces an unusually satisfying No. 1. Dave Concepción finishes first.
He is not first because the algorithm happens to reward longevity. He is also not first because of one extraordinary short peak. Concepción ranks first in overall two-way performance and first when the calculation is restricted to the best three-season peak. Offensively, he ranks second among the qualifying shortstops, while his traditional defense ranks fifth.
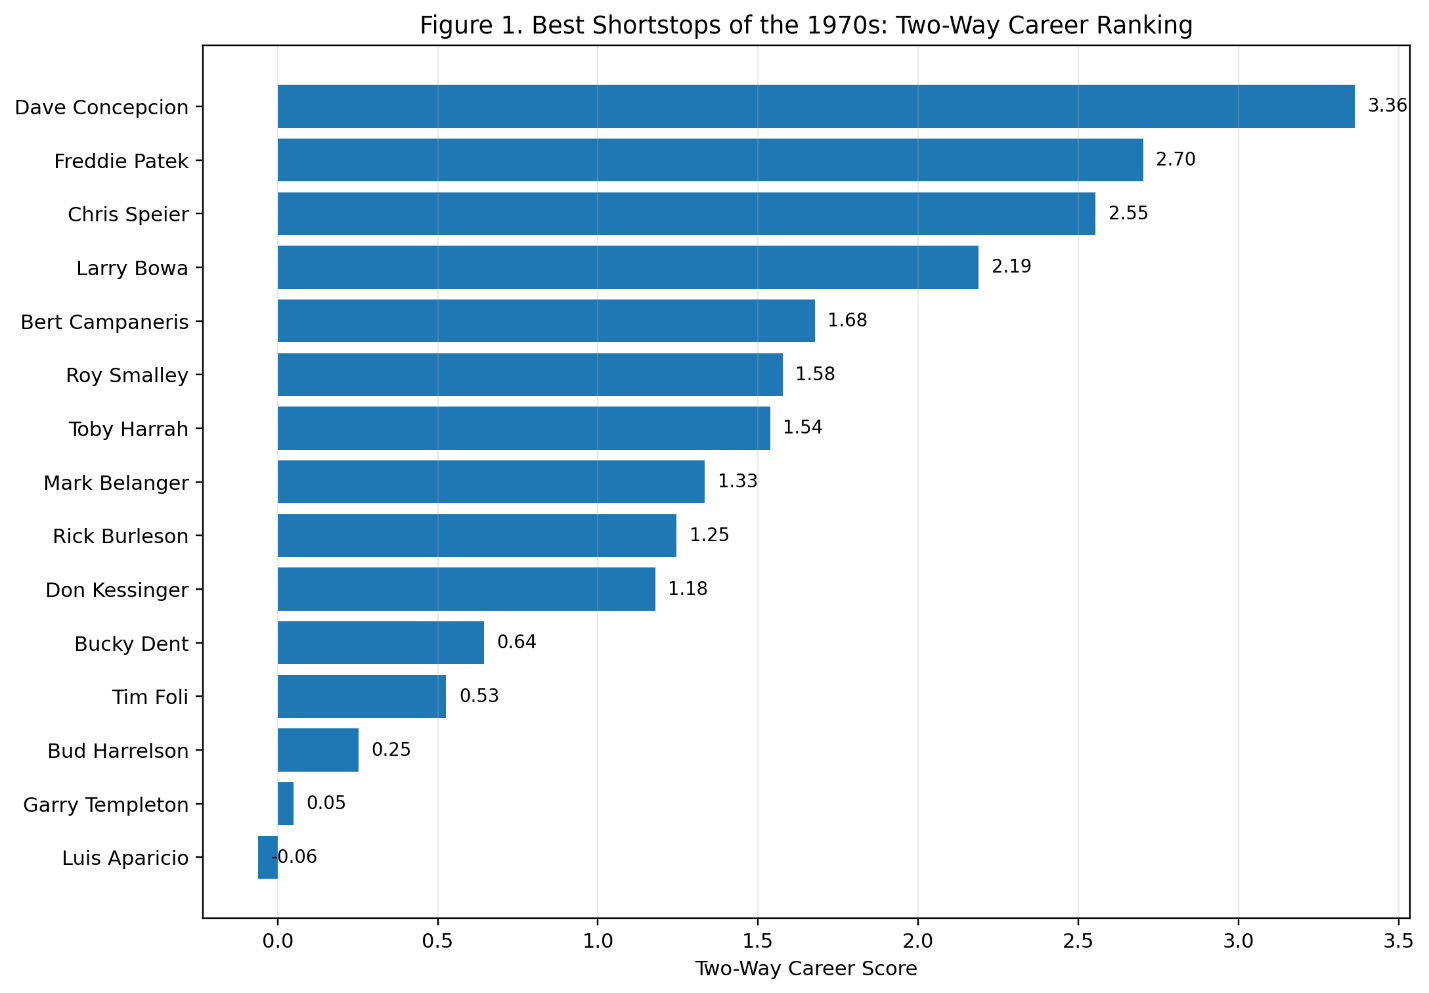
Figure 1. Best Shortstops of the 1970s: Two-Way Career Ranking.
Figure 1 shows how much separation Concepción creates. His standardized two-way career score of 3.36 comfortably exceeds Freddie Patek at 2.70 and Chris Speier at 2.55. Larry Bowa follows at 2.19, with Bert Campaneris rounding out the top five at 1.68.
The complete top ten is revealing:
| Rank | Player | Offensive Rank | Defensive Rank | Peak Rank |
|---|---|---|---|---|
| 1 | Dave Concepción | 2 | 5 | 1 |
| 2 | Freddie Patek | 3 | 7 | 2 |
| 3 | Chris Speier | 4 | 6 | 3 |
| 4 | Larry Bowa | 16 | 1 | 7 |
| 5 | Bert Campaneris | 5 | 12 | 8 |
| 6 | Roy Smalley | 6 | 13 | 4 |
| 7 | Toby Harrah | 1 | 27 | 6 |
| 8 | Mark Belanger | 25 | 2 | 9 |
| 9 | Rick Burleson | 9 | 9 | 5 |
| 10 | Don Kessinger | 7 | 11 | 11 |
The list immediately tells us something important. There was not one model of a successful 1970s shortstop. There were several.
Concepción simply inhabited the most valuable part of that landscape.
Concepción and the Power of Balance
Concepción’s offensive score for the decade is 31.83, second among the group, while his defensive score is 19.88, fifth. His strength is therefore not hidden inside a single category. He rates very well in both.
That balance is visible when offense and defense are plotted separately.
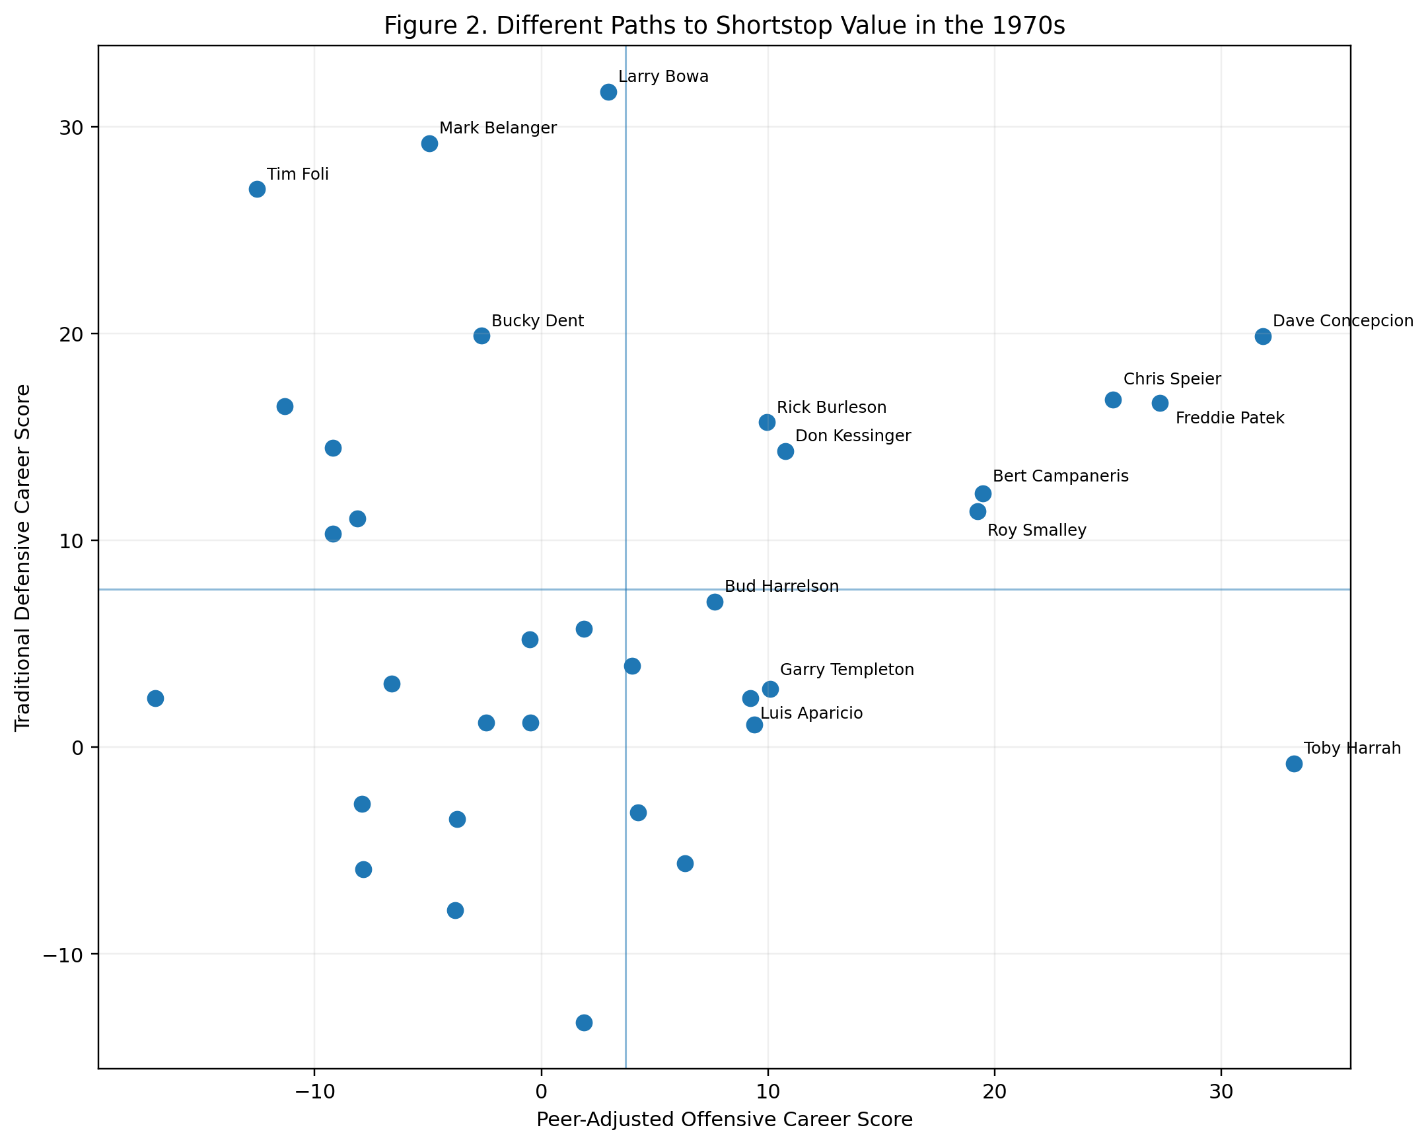
Figure 2. Different Paths to Shortstop Value in the 1970s.
The horizontal dimension in Figure 2 represents peer-adjusted offense. The vertical dimension represents traditional defense. Players in the upper-right portion of the chart are the rare shortstops who contributed substantially in both areas.
Concepción occupies exactly the region we would hope the best shortstop would occupy. Chris Speier and Freddie Patek are nearby, though neither reaches quite as far offensively. The graph makes Concepción’s advantage easier to understand than a ranking alone can.
It also reveals something much more interesting about the rest of the decade.
Larry Bowa and Mark Belanger live high on the defensive axis. Toby Harrah sits far to the right offensively but dramatically lower defensively. Freddie Patek, Chris Speier, Bert Campaneris, and Roy Smalley occupy a more balanced middle ground.
Different players reached value by very different routes.
The Freddie Patek Problem
If anything in this study surprised me, it wasn’t Concepción finishing first. It is Freddie Patek finishing second.
Patek ranks third offensively, seventh defensively, second in three-year peak, and second overall. His two-way career score of 2.70 places him ahead of Speier, Bowa, Campaneris, and Belanger.
That doesn’t look obvious if we start with conventional batting statistics. Patek was not a slugger. He did not put up the sort of raw offensive totals that jump from a baseball card.
But that is exactly why positional and seasonal context matter. Patek was being compared with other 1970s shortstops, not with Reggie Jackson or Willie Stargell. His ability to get on base, create runs with his legs, avoid being a complete offensive liability, and still provide useful defense matters more when evaluated against his positional peers.
The model does not claim that Patek was one of the best hitters in baseball. It says something narrower and more interesting: relative to what teams were receiving from shortstop, Freddie Patek created a surprisingly large amount of value.
That distinction is essential.
Chris Speier: The Quietly Complete Shortstop
Patek may be the surprise, but Chris Speier might be the cleanest example of an underrated two-way player.
Speier ranks fourth offensively and sixth defensively. Those rankings combine to place him third overall, and he is also third in three-season peak.
There is nothing extreme about his statistical profile. That is precisely what makes him interesting.
He does not need Harrah’s offensive advantage. He does not need Belanger’s defensive advantage. Speier remains near the top because there is no obvious weakness in his profile relative to other shortstops of the decade.
Baseball history sometimes remembers specialists more vividly than balanced players. Extraordinary power is memorable. Extraordinary defense produces highlight plays and reputations. A player who is simply very good at everything can be easier to overlook.
Speier appears to have been that kind of shortstop.
Larry Bowa and Mark Belanger
Now the geometry changes. Larry Bowa ranks only 16th offensively, but he finishes first defensively in the traditional model. The strength of that defense is sufficient to elevate him to fourth overall.
Mark Belanger pushes the idea even further. His offense ranks 25th, near the bottom of the serious candidates, but his defense ranks second. The combination still carries him all the way to eighth overall.
This is where the external evidence becomes particularly useful. Belanger won seven Gold Gloves during the decade. The Gold Gloves are not part of the model. They were added only after the rankings were calculated, so the agreement between the traditional defensive score and contemporary recognition serves as a useful independent check.
It does not prove that our defensive score measures everything correctly. Nothing built from traditional fielding statistics could. But if a model designed to detect exceptional traditional defense places Mark Belanger near the top, and contemporary observers repeatedly reached the same conclusion, that is reassuring.
Toby Harrah and the Other Extreme
If Bowa and Belanger demonstrate how defense can carry a shortstop, Toby Harrah demonstrates the opposite.
Harrah ranks first offensively among the qualifying shortstops of the decade. Defensively, however, he falls to 27th. That combination leaves him seventh overall, despite having the strongest offensive score in the study.
That makes Harrah one of the most informative players in the analysis. If we ranked shortstops by offense alone, Harrah would win. If we ranked them by traditional defense alone, Bowa would win. If we ask who combined the two dimensions most successfully, Concepción wins.
Those are three different questions. They deserve three different answers.
Peak Value Changes Less Than Expected
Career rankings can sometimes reward players who were merely good for a long time. A shorter peak measurement helps expose that problem.
For this study, I calculated each player’s best three-season two-way peak. The result strengthens rather than weakens Concepción’s case.
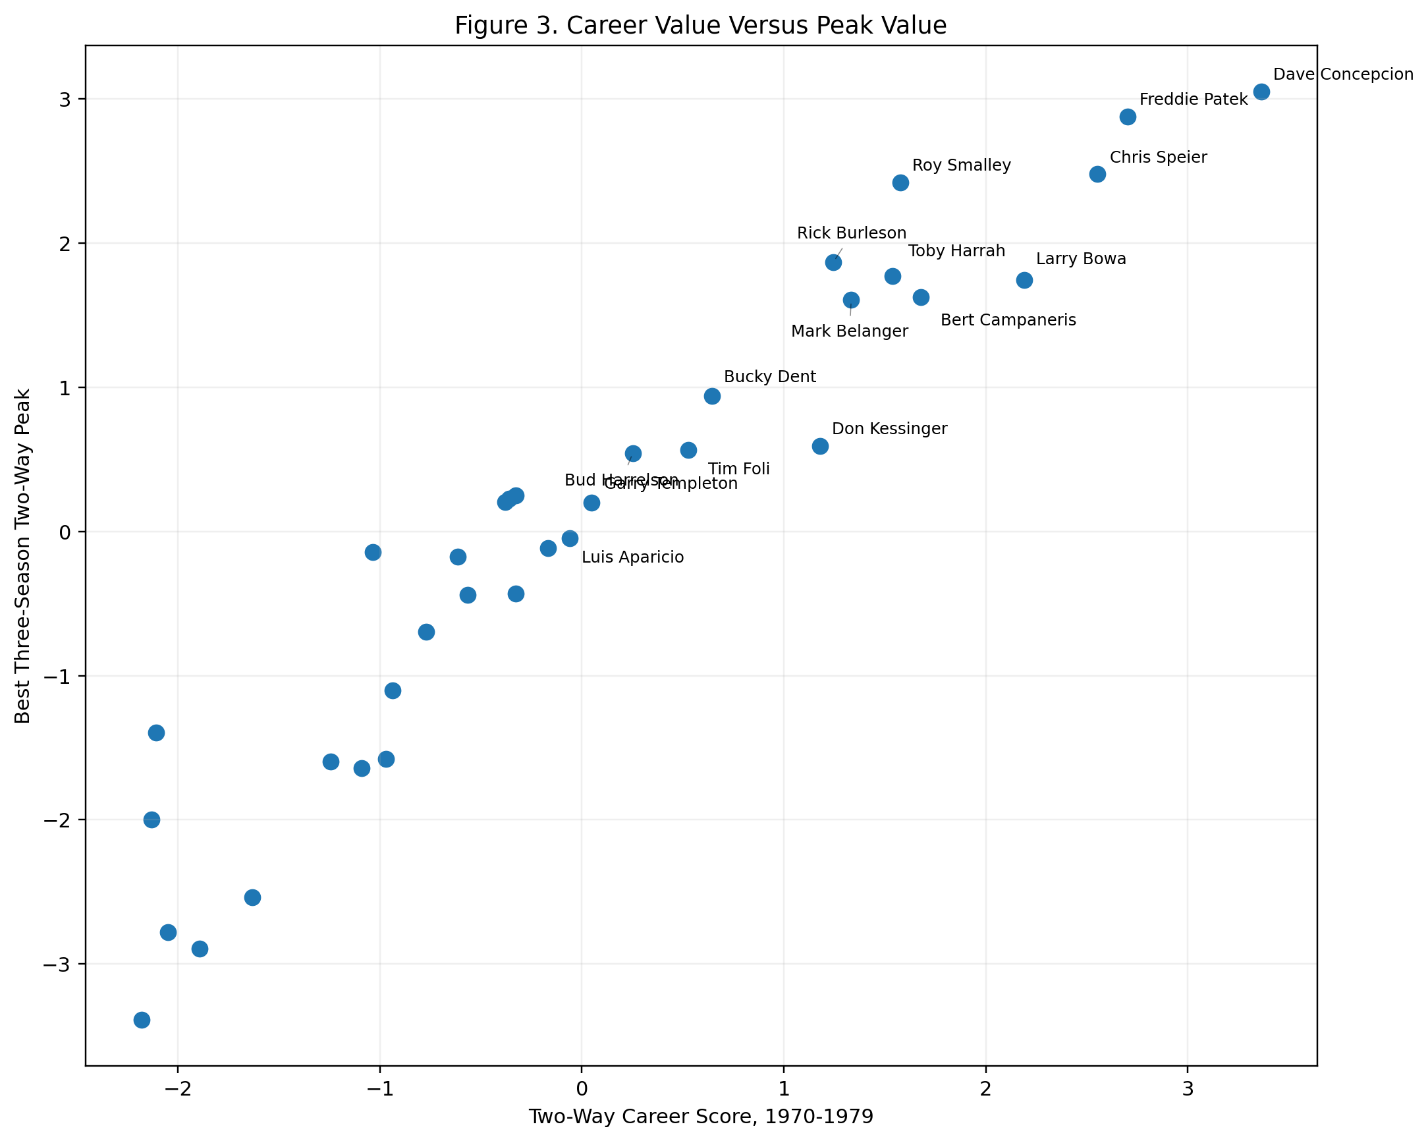
Figure 3. Career Value Versus Peak Value.
Concepción is again first. Patek is second and Speier third, giving us the same top three produced by the decade-long measure.
Roy Smalley becomes especially interesting here. He ranks sixth in decade value but fourth in peak value, despite having only four qualifying offensive seasons in the 1970s. Rick Burleson similarly rises to fifth in peak performance while ranking ninth over the full decade.
That distinction is useful because a decade boundary is artificial. Smalley did not organize his career around our decision to begin counting on January 1, 1970, and stop after the 1979 season. Younger players entering late in the decade naturally have less opportunity to accumulate career value.
Peak analysis gives them a second way into the conversation.
The Clusters of Shortstop Greatness
A ranking forces players onto a line. Baseball players rarely exist on one.
Cluster analysis lets us approach the same group differently. Instead of asking who ranks first, second, or third, we ask which players possess similar statistical profiles.
For Figure 4, we clustered the top 15 shortstops using standardized offensive performance, defensive performance, and three-season peak value.
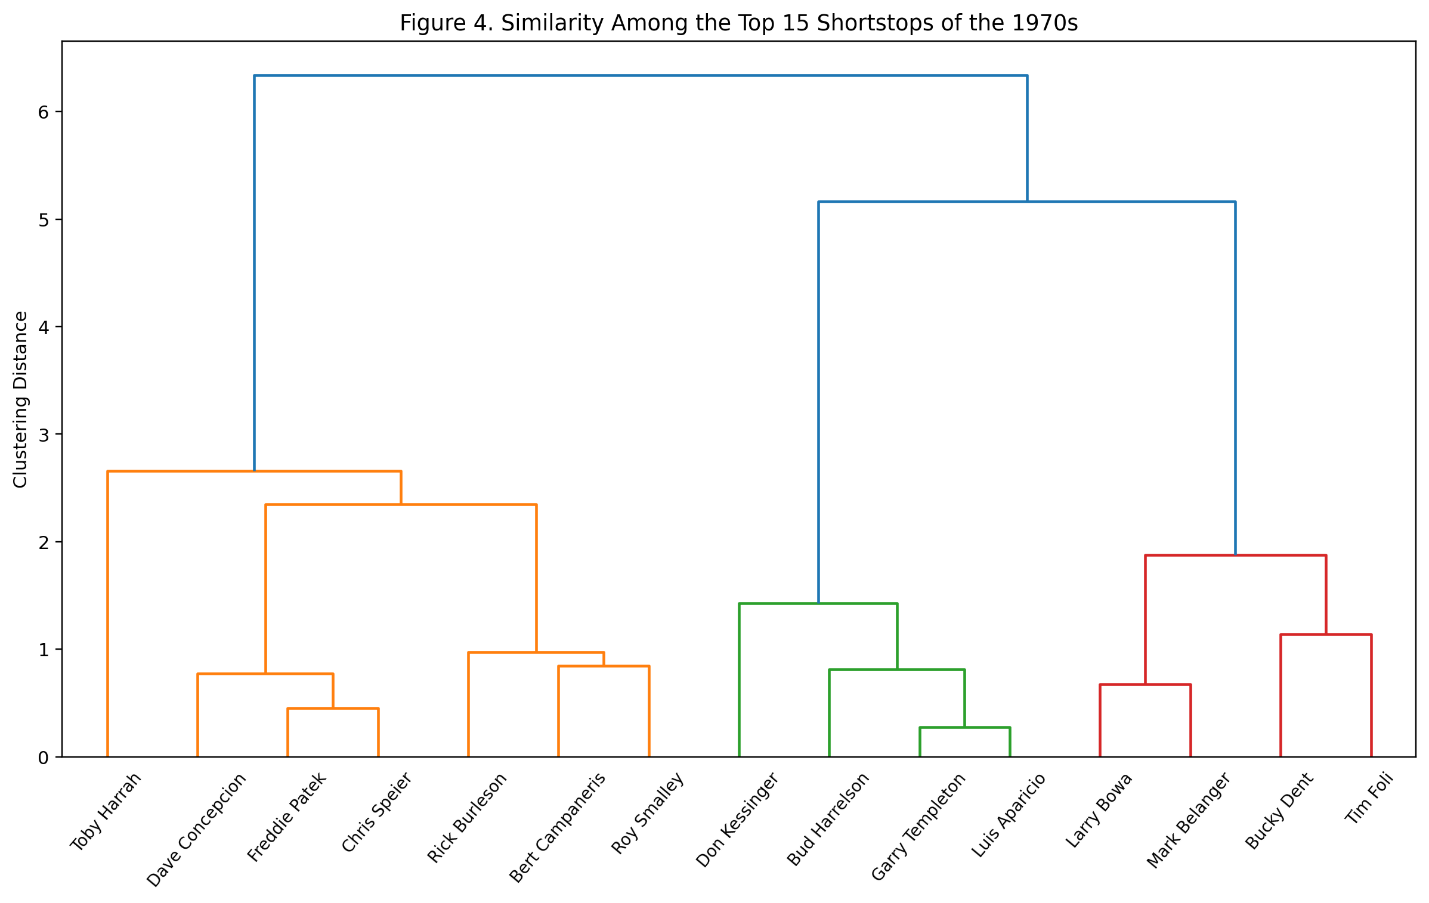
Figure 4. Similarity Among the Top 15 Shortstops of the 1970s.
The dendrogram reinforces what Figure 2 suggested. Toby Harrah branches away from the more balanced offensive group because of his unusual offense-first profile. Concepción, Patek, and Speier cluster much more naturally with one another, while Bowa and Belanger occupy the defense-heavy side of the landscape.
This is one reason I like clustering for historical baseball analysis. Two players can finish near each other in a ranking without being remotely similar players.
The ranking tells us how much value the model identifies. The dendrogram begins to tell us what kind of player produced it.
What About Contemporary Reputation?
Only after completing the statistical rankings did I bring All-Star selections and Gold Gloves into the study.
The comparison is fascinating. Concepción made six All-Star teams during the decade and won five Gold Gloves. Larry Bowa made five All-Star teams and won two Gold Gloves. Campaneris was selected five times. Belanger, despite only one All-Star selection during the decade, accumulated seven Gold Gloves.
Concepción’s contemporary reputation therefore lines up remarkably well with the model. The statistical system identifies him as the decade’s best all-around shortstop, while the people watching and voting at the time repeatedly recognized both his overall quality and his defense.
Patek provides the more provocative contrast. He made three All-Star teams but won no Gold Gloves, yet the model places him second overall. Speier also made three All-Star teams and won no Gold Gloves during the decade, but finishes third.
Perhaps those players were better than their historical reputations now suggest. Perhaps our model is capturing forms of value that were less likely to produce awards. More likely, it is some combination of both.
Either way, the discrepancy is worth noticing.
Testing the Ranking
Any historical ranking should survive reasonable changes to its assumptions.
The original model required at least three qualifying shortstop seasons. I therefore repeated the ranking with a substantially stricter requirement of five qualifying seasons.
The top five remained unchanged: Dave Concepción, Freddie Patek, Chris Speier, Larry Bowa, and Bert Campaneris.
That stability matters. A ranking that changes dramatically because a cutoff moves from three seasons to five would make me nervous. Here, the central conclusion survives.
Concepción does not win because of an arbitrary eligibility rule. Patek and Speier do not appear near the top because of a tiny sample. Bowa and Campaneris remain firmly in the same group.
The deeper we look, the more stable the top of the ranking becomes.
What the Model Cannot Tell Us
There is still a limit to what we can claim.
Traditional fielding statistics are not modern defensive metrics. Assists depend partly on opportunity. Double plays depend partly on the second baseman and the pitching staff. Fielding percentage cannot tell us whether a defender reached a ball another shortstop would never have touched.
Those limitations become particularly important when interpreting players such as Belanger, Bowa, and Bill Russell. A ranking constructed from traditional fielding data should not be read as a precise estimate of defensive runs saved.
It is better understood as a historical reconstruction from the evidence available.
That is still valuable. The goal is not to pretend we possess Statcast data from 1975. The goal is to combine the surviving information carefully enough that patterns begin to emerge.
And several patterns do.
So, Who Was the Best?
After offense, defense, longevity, peak value, sensitivity testing, and comparison with contemporary recognition, I think the answer is Dave Concepción.
His case is unusually complete. He ranks second offensively, fifth defensively, first overall, and first in three-season peak. He also received substantial contemporary recognition, with six All-Star appearances and five Gold Gloves during the decade.
But the study would be much less interesting if it ended there.
Freddie Patek’s second-place finish may be the most surprising result. Chris Speier emerges as perhaps the most underrated balanced shortstop of the decade. Larry Bowa and Mark Belanger demonstrate the extraordinary value that defense could carry at the position. At the same time, Toby Harrah shows how far outstanding offense could push a shortstop even when his traditional defensive record lagged behind.
That is what I like most about the result.
There was no single template for a great shortstop in the 1970s. Harrah, Belanger, Bowa, Patek, Speier, Campaneris, and Concepción reached value by different paths. The data does not erase those differences by forcing everyone into the same mold.
Instead, it makes the differences visible. And when offense and defense are finally brought together, Dave Concepción is the player standing highest in the middle.