The Distribution of Offensive Performance in Major League Baseball, 2026
A Statistical Examination of Baseball’s Best, Worst, and Most Typical Hitters
I’ve completed an analysis using FanGraphs data, and the results are quite interesting.
The most important initial discovery is that offensive performance among established MLB hitters is remarkably close to a normal distribution. However, that distribution changes substantially depending on the minimum number of plate appearances we recognize.
I created five figures to illustrate the findings.
Establishing our population
The expanded FanGraphs dataset contains 1,472 player records. Of those, 662 recorded at least one plate appearance during the 2026 regular season. For the primary analysis, I selected 250 plate appearances, giving us 318 players. However, I also examined several alternative thresholds.
| Minimum PA | Players | Mean wRC+ | Median wRC+ | Standard deviation |
|---|---|---|---|---|
| 1 | 662 | 81.87 | 89.74 | 52.31 |
| 100 | 465 | 95.17 | 96.28 | 26.26 |
| 250 | 318 | 102.52 | 101.75 | 21.46 |
| 400 | 205 | 108.25 | 107.01 | 19.90 |
| 502 | 135 | 111.29 | 110.53 | 19.98 |
Notice what happens as we increase the minimum playing-time requirement. The mean rises, while the standard deviation generally decreases. This is consistent with two processes operating together: small-sample extremes becoming less influential and better hitters tending to accumulate more plate appearances.
There is an important selection effect here. Players with poor offensive performances are less likely to receive 500 or more plate appearances. Consequently, the average performance of our qualified hitters is considerably better than the MLB-wide benchmark of 100 wRC+.
Is offensive performance normally distributed?
For our primary population of 318 players, the descriptive statistics are:
| Statistic | wRC+ |
|---|---|
| Mean | 102.52 |
| Median | 101.75 |
| Standard deviation | 21.46 |
| Minimum | 32.62 |
| Maximum | 180.82 |
| First quartile | 89.22 |
| Third quartile | 116.23 |
| Interquartile range | 27.01 |
| Skewness | 0.06 |
| Excess kurtosis | 0.25 |
The mean and median are remarkably close. Furthermore, the skewness of 0.06 suggests that the distribution is approximately symmetrical. The kurtosis is also reasonably close to that expected under a normal distribution.
Figure 1. Distribution of wRC+ among players with at least 250 PA
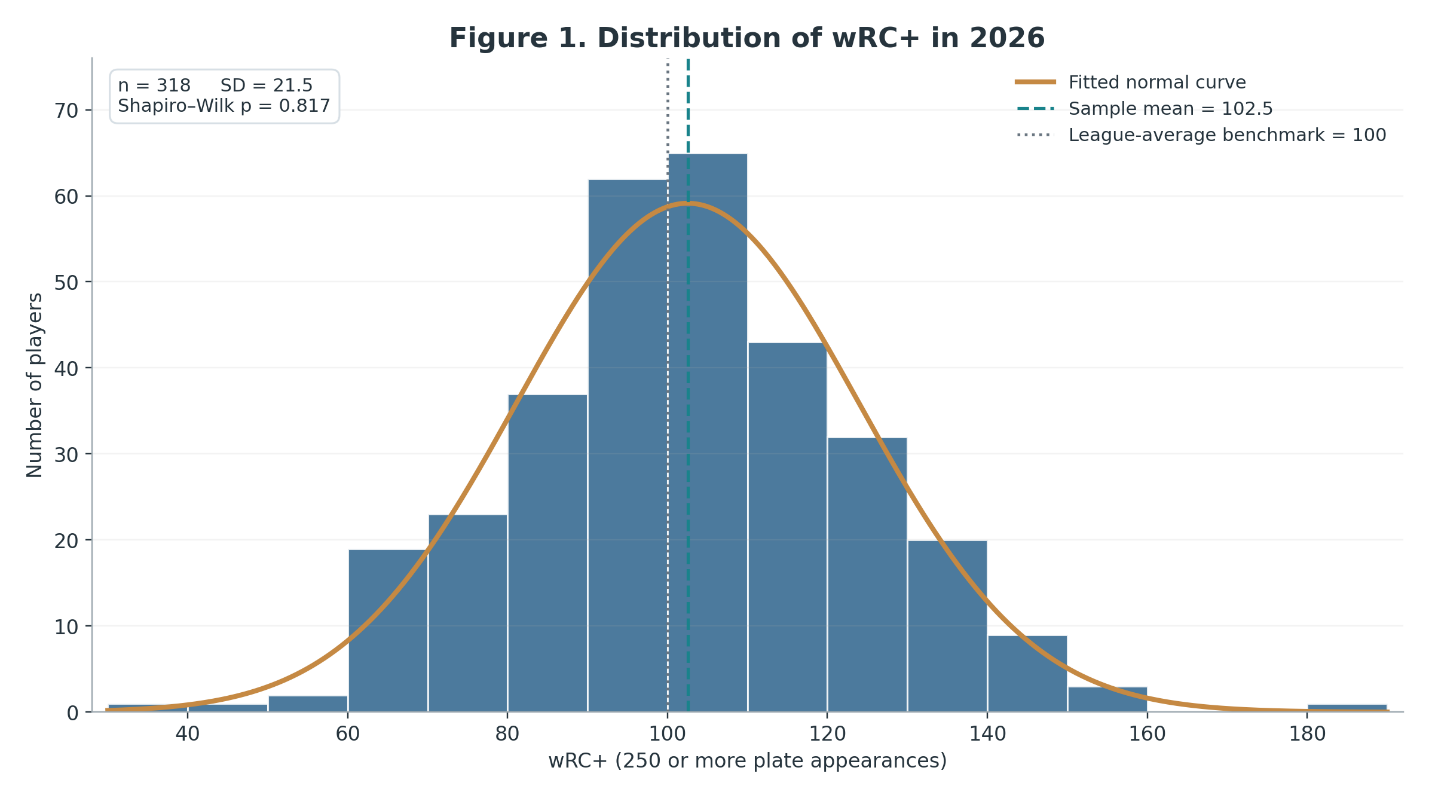
The histogram shows a distribution that closely resembles the familiar bell curve. Kind of beautiful, isn’t it?
I also performed a Shapiro-Wilk normality test.
The result was:
At the conventional significance level of 0.05, we cannot reject the hypothesis that the observations came from a normally distributed population. This does not prove that offensive performance follows a normal distribution. Nevertheless, the descriptive statistics, histogram, and formal test all support approximate normality within this selected group. That gives us a useful starting point for identifying unusually good and unusually poor offensive seasons.
What happens when we change the qualification threshold?
This is where the analysis becomes particularly revealing.
Figure 2. Box plots by minimum plate appearances
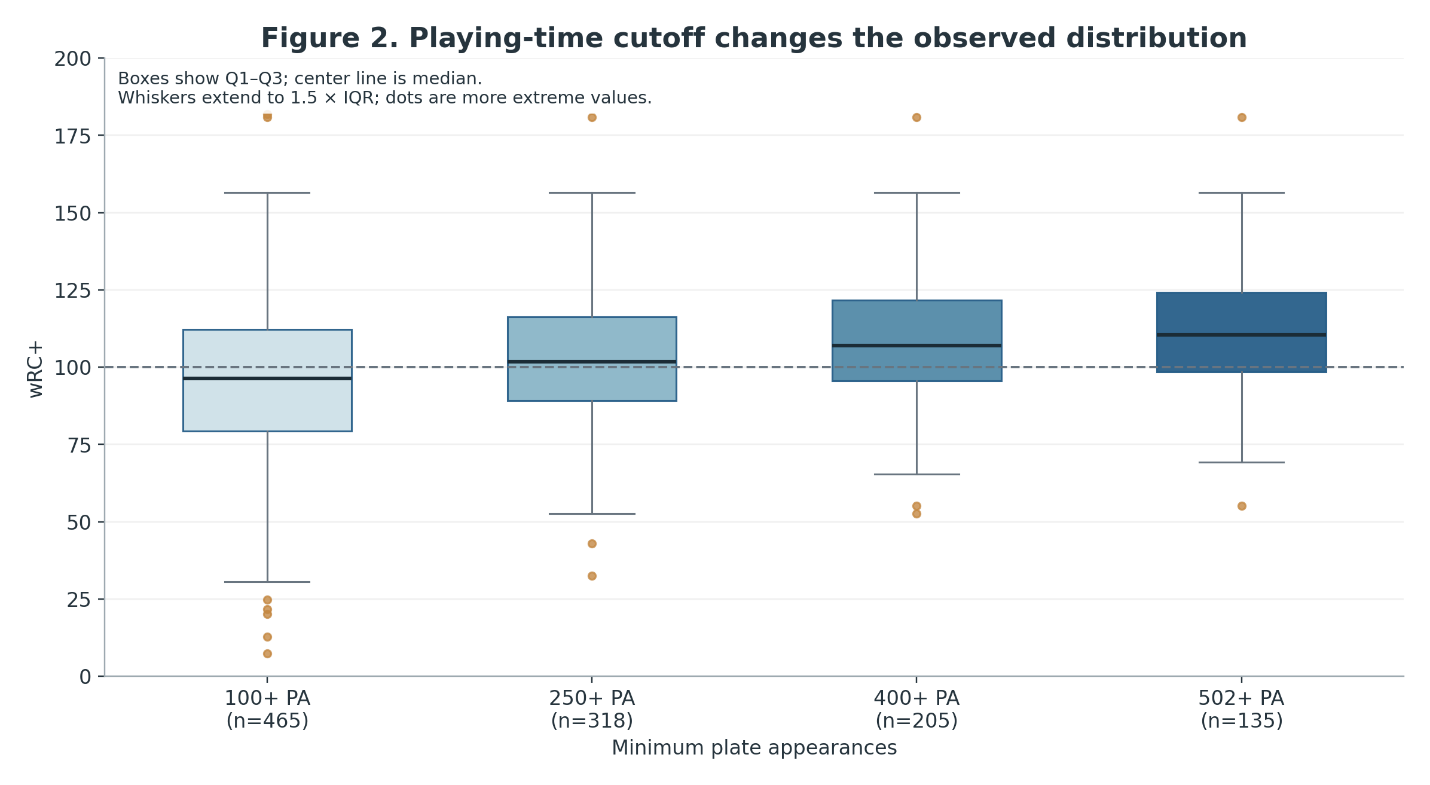
These box plots have a story to tell. As the qualification threshold increases, the entire distribution shifts upward. The median moves from approximately 96 wRC+ among players with at least 100 plate appearances to approximately 111 among players with at least 502. At the same time, the lower tail becomes less extreme.
This suggests that playing time is strongly associated with offensive performance, although the relationship does not establish causation.
We must also remember that these groups overlap. The 502-PA sample is contained within the 400-PA sample, which is itself contained within the 250-PA sample.
Figure 3. Plate appearances versus offensive performance
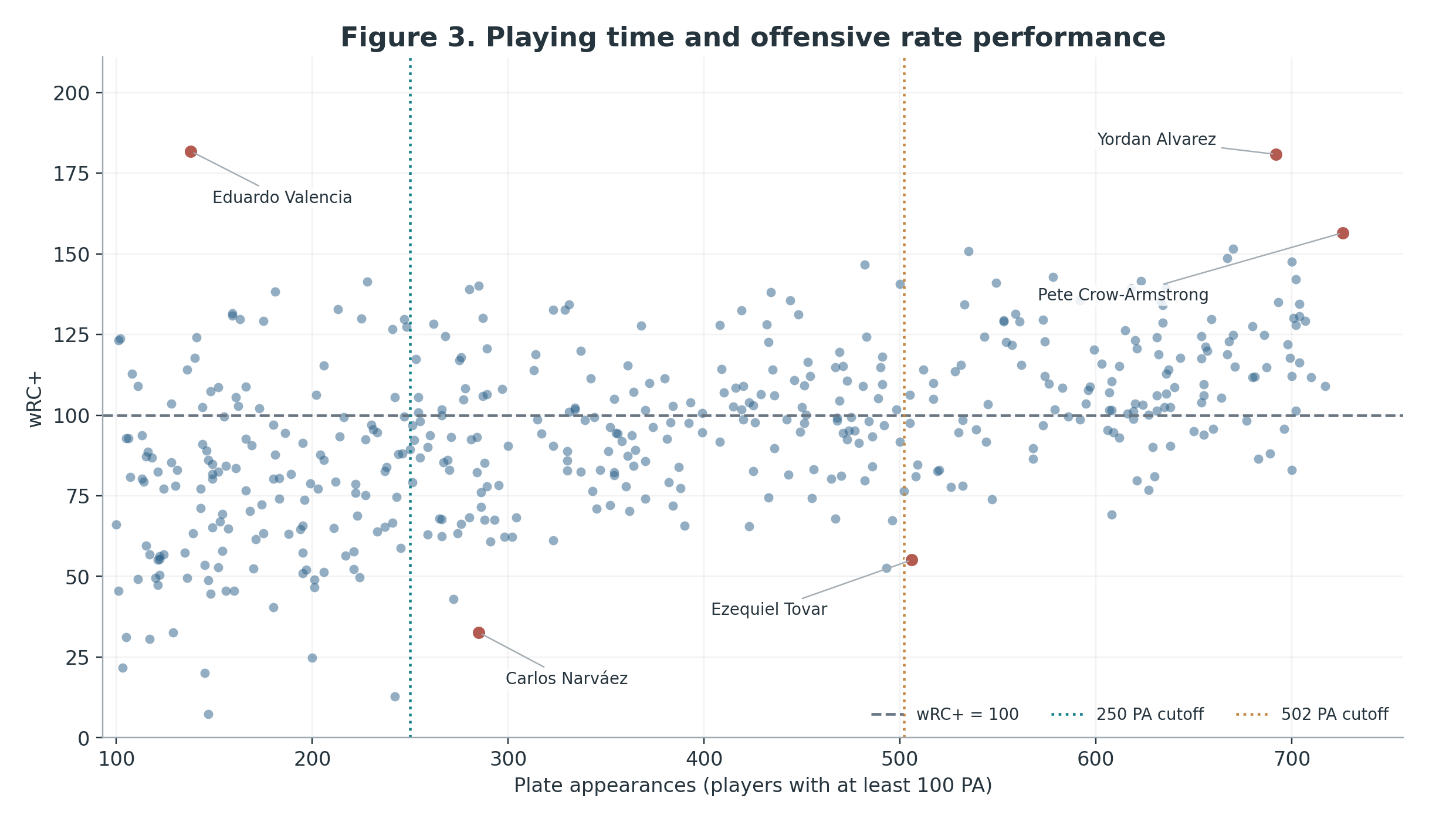
This scatterplot makes the relationship clearer.
Among the 465 players with at least 100 plate appearances, the Pearson correlation between PA and wRC+ is approximately:
That is a moderate positive association. Players accumulating more plate appearances generally have better offensive statistics. However, this does not mean more plate appearances make a player a better hitter. Rather, teams are likely to give more opportunities to players who perform better. Injuries, defensive contributions, contracts, and roster decisions also influence playing time. This distinction will become especially important when we begin constructing regression models.
Identifying the best offensive performances
We can now begin identifying the extremes of the distribution.
Using our primary 250-PA threshold, the five highest wRC+ performances were:
| Player | PA | wRC+ |
|---|---|---|
| Yordan Alvarez | 692 | 180.82 |
| Pete Crow-Armstrong | 726 | 156.52 |
| Randy Arozarena | 670 | 151.48 |
| Willson Contreras | 535 | 150.78 |
| Ben Rice | 667 | 148.72 |
Alvarez stands comfortably ahead of the rest. His wRC+ of 180.82 indicates offensive production per plate appearance approximately 81% above the league-average benchmark after the adjustments incorporated into wRC+. He is also an exceptionally unusual observation within our selected population.
Using the familiar box-plot definition of an outlier, we obtain an upper fence of approximately 156.74. Alvarez exceeds that threshold. Interestingly, Crow-Armstrong, with a wRC+ of 156.52, falls just below it.
The worst offensive performances
At the opposite extreme:
| Player | PA | wRC+ |
|---|---|---|
| Carlos Narváez | 285 | 32.62 |
| TJ Friedl | 272 | 43.00 |
| Nasim Nuñez | 493 | 52.69 |
| Ezequiel Tovar | 506 | 55.12 |
| Matt Vierling | 291 | 60.74 |
Narváez and Friedl fall below the conventional lower outlier fence of approximately 48.71. Thus, using the 1.5 × IQR criterion, we identify three statistical outliers in our 318-player sample: one exceptionally high and two exceptionally low.
Figure 4. The extremes of offensive performance
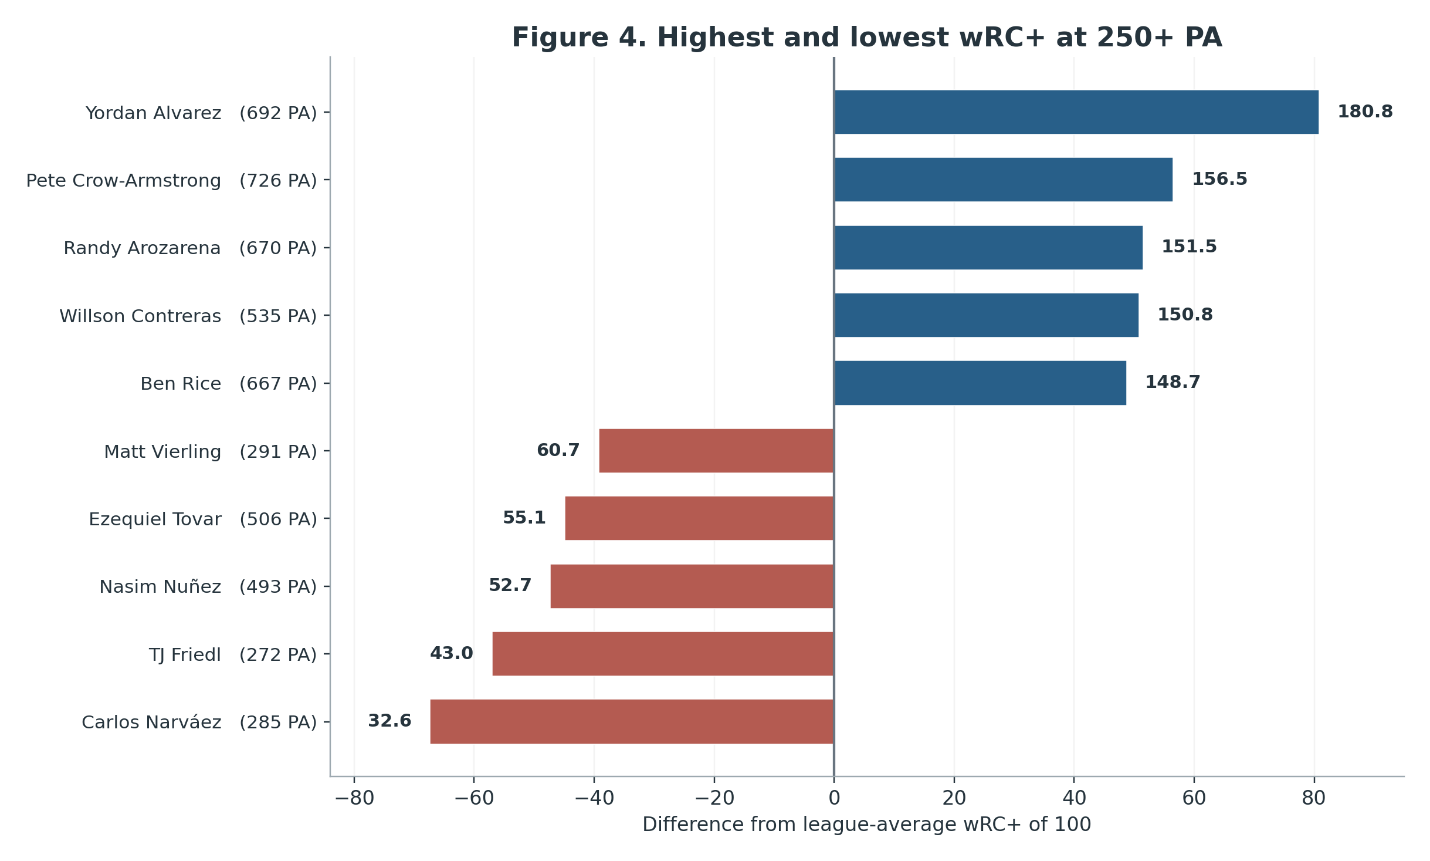
These rankings are based on offensive rate performance. They do not necessarily identify the players who contributed the most or fewest total offensive runs. That distinction is our next important finding.
Offensive excellence versus offensive contribution
Consider the following comparison.
Yordan Alvarez recorded a wRC+ of 180.82 over 692 plate appearances.
Pete Crow-Armstrong recorded a wRC+ of 156.52 over 726 plate appearances.
Alvarez was substantially better as a hitter on a rate basis. However, the difference between their total offensive contributions was much smaller.
| Player | wRC+ | Offensive Runs |
|---|---|---|
| Yordan Alvarez | 180.82 | +60.14 |
| Pete Crow-Armstrong | 156.52 | +57.68 |
| Randy Arozarena | 151.48 | +42.31 |
| Ben Rice | 148.72 | +36.38 |
| Pete Alonso | 147.51 | +34.73 |
Why?
Because FanGraphs’ Off statistic includes both batting and baserunning contributions. Alvarez’s extraordinary hitting performance was partially offset by negative baserunning value. Crow-Armstrong, meanwhile, accumulated substantial positive baserunning value.
This illustrates the importance of distinguishing among batting ability, offensive rate performance, and cumulative offensive contribution.
Figure 5. Offensive rate performance versus total offensive contribution
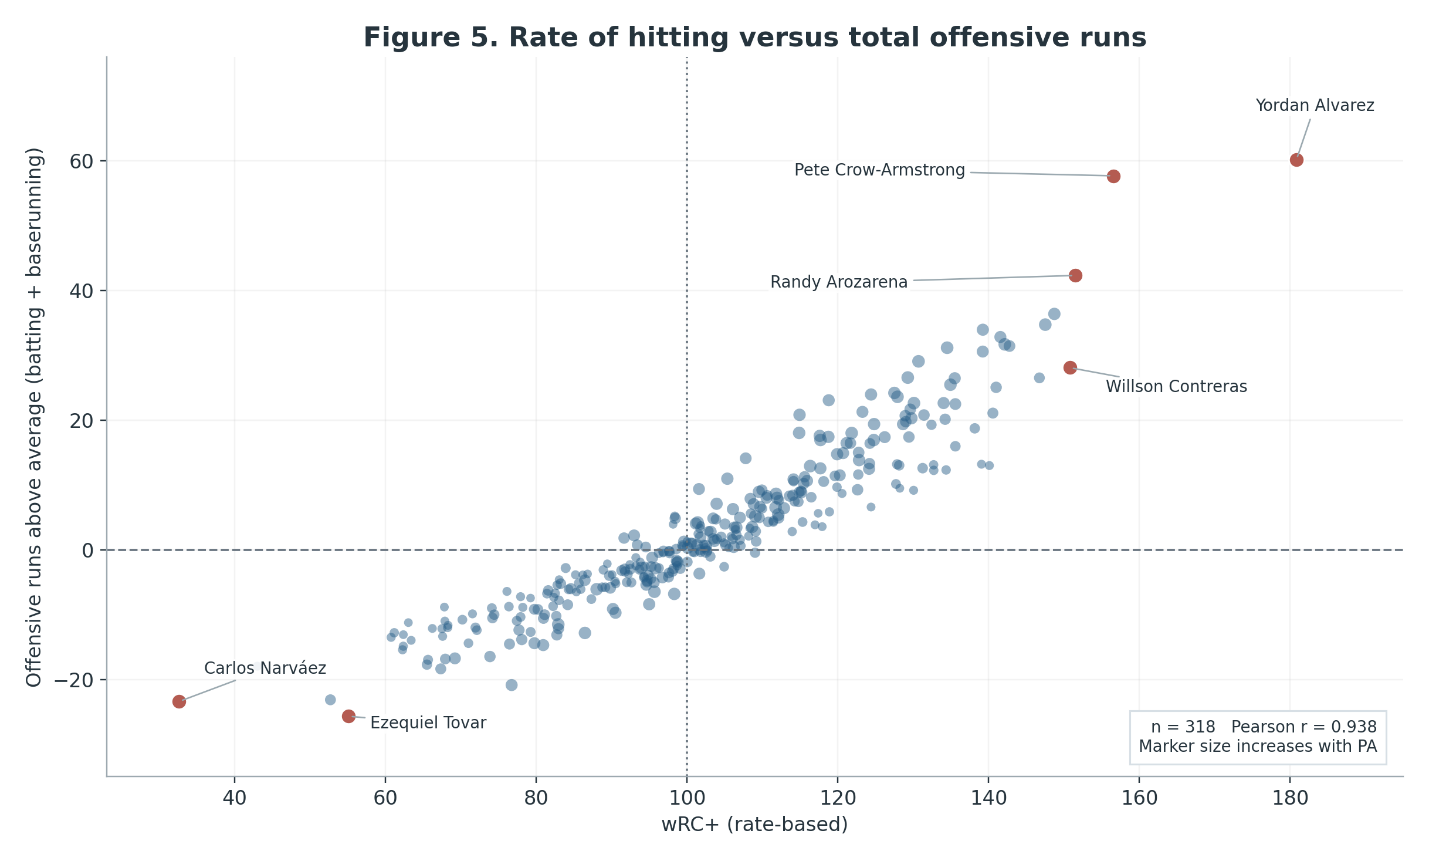
The relationship is extremely strong.
Among the 318 players with at least 250 plate appearances:
Players with higher wRC+ generally accumulate more total offensive runs. However, these measures are not independent. They share underlying batting information, and total offensive runs also depend on opportunities and baserunning. Consequently, the high correlation is expected. It should not be interpreted as evidence that wRC+ predicts Off independently.
The most interesting players may actually be those who deviate from the general relationship. Crow-Armstrong is an excellent example.
6. What about the worst cumulative offensive performances?
Here the rankings change.
Among players with at least 250 plate appearances, the lowest total offensive contributions were:
| Player | PA | wRC+ | Offensive Runs |
|---|---|---|---|
| Ezequiel Tovar | 506 | 55.12 | -25.67 |
| Carlos Narváez | 285 | 32.62 | -23.39 |
| Nasim Nuñez | 493 | 52.69 | -23.14 |
| Salvador Perez | 627 | 76.72 | -20.86 |
| Matt McLain | 496 | 67.33 | -18.37 |
This illustrates why identifying the worst offensive season requires some methodological care. Carlos Narváez had the lowest wRC+ among players meeting our 250-PA threshold. However, Ezequiel Tovar accumulated the largest negative offensive contribution. Tovar was not the least effective hitter per plate appearance, but he accumulated substantially more playing time.
In other words, the worst offensive rate performance and the greatest cumulative offensive deficit are not necessarily produced by the same player. That is a distinction worth preserving throughout this project.
Some preliminary conclusions
Five important findings have emerged.
First, offensive performance among MLB players meeting moderate playing-time thresholds appears approximately normally distributed.
Second, the distribution changes considerably as we adjust the qualification threshold. This means that rankings, averages, and outlier classifications are sensitive to how we define the population.
Third, Yordan Alvarez clearly distinguished himself as the outstanding offensive-rate performer among players receiving substantial playing time. His performance is also a statistical high outlier using our primary sample.
Fourth, the distinction between hitting effectiveness and total offensive contribution matters. Exceptional baserunning can considerably change a player’s total offensive value.
Finally, players with more plate appearances tend to have better offensive statistics. This suggests that any attempt to model offensive performance needs to consider playing-time selection effects.
A methodological caution
We should keep one additional issue in mind. The closer agreement with a normal distribution at higher PA thresholds does not necessarily reveal the natural underlying distribution of hitting ability. We are observing a selected population. Its composition depends partly on decisions made by managers, front offices, and players themselves.
Thus, the distribution of observed offensive performance is not necessarily identical to the distribution of underlying offensive talent. That distinction could become important in subsequent studies.