Payroll Matters in MLB (semantic ambiguity intentional)
There is a simple baseball question that seems to have a straightforward answer. Do teams with big payrolls win more often than the others?
The intuitive answer is yes, right? The richer teams should and do win more often. They can sign stars, absorb bad contracts, buy depth, survive injuries, and patch roster holes at the trade deadline. As the Dodgers know, baseball has no hard salary cap, so money should matter.
And it does. But after looking at MLB Opening Day payrolls and regular-season wins from 2000 through 2025, the more interesting answer is this:
Payroll matters, but it explains far less than we might expect.
Across the full period, the average annual R² is about 0.154. In plain English, Opening Day payroll explained roughly 15.4% of the variation in team wins across seasons.
Surprised? Most of the people I have talked to think the number would be much, much higher.
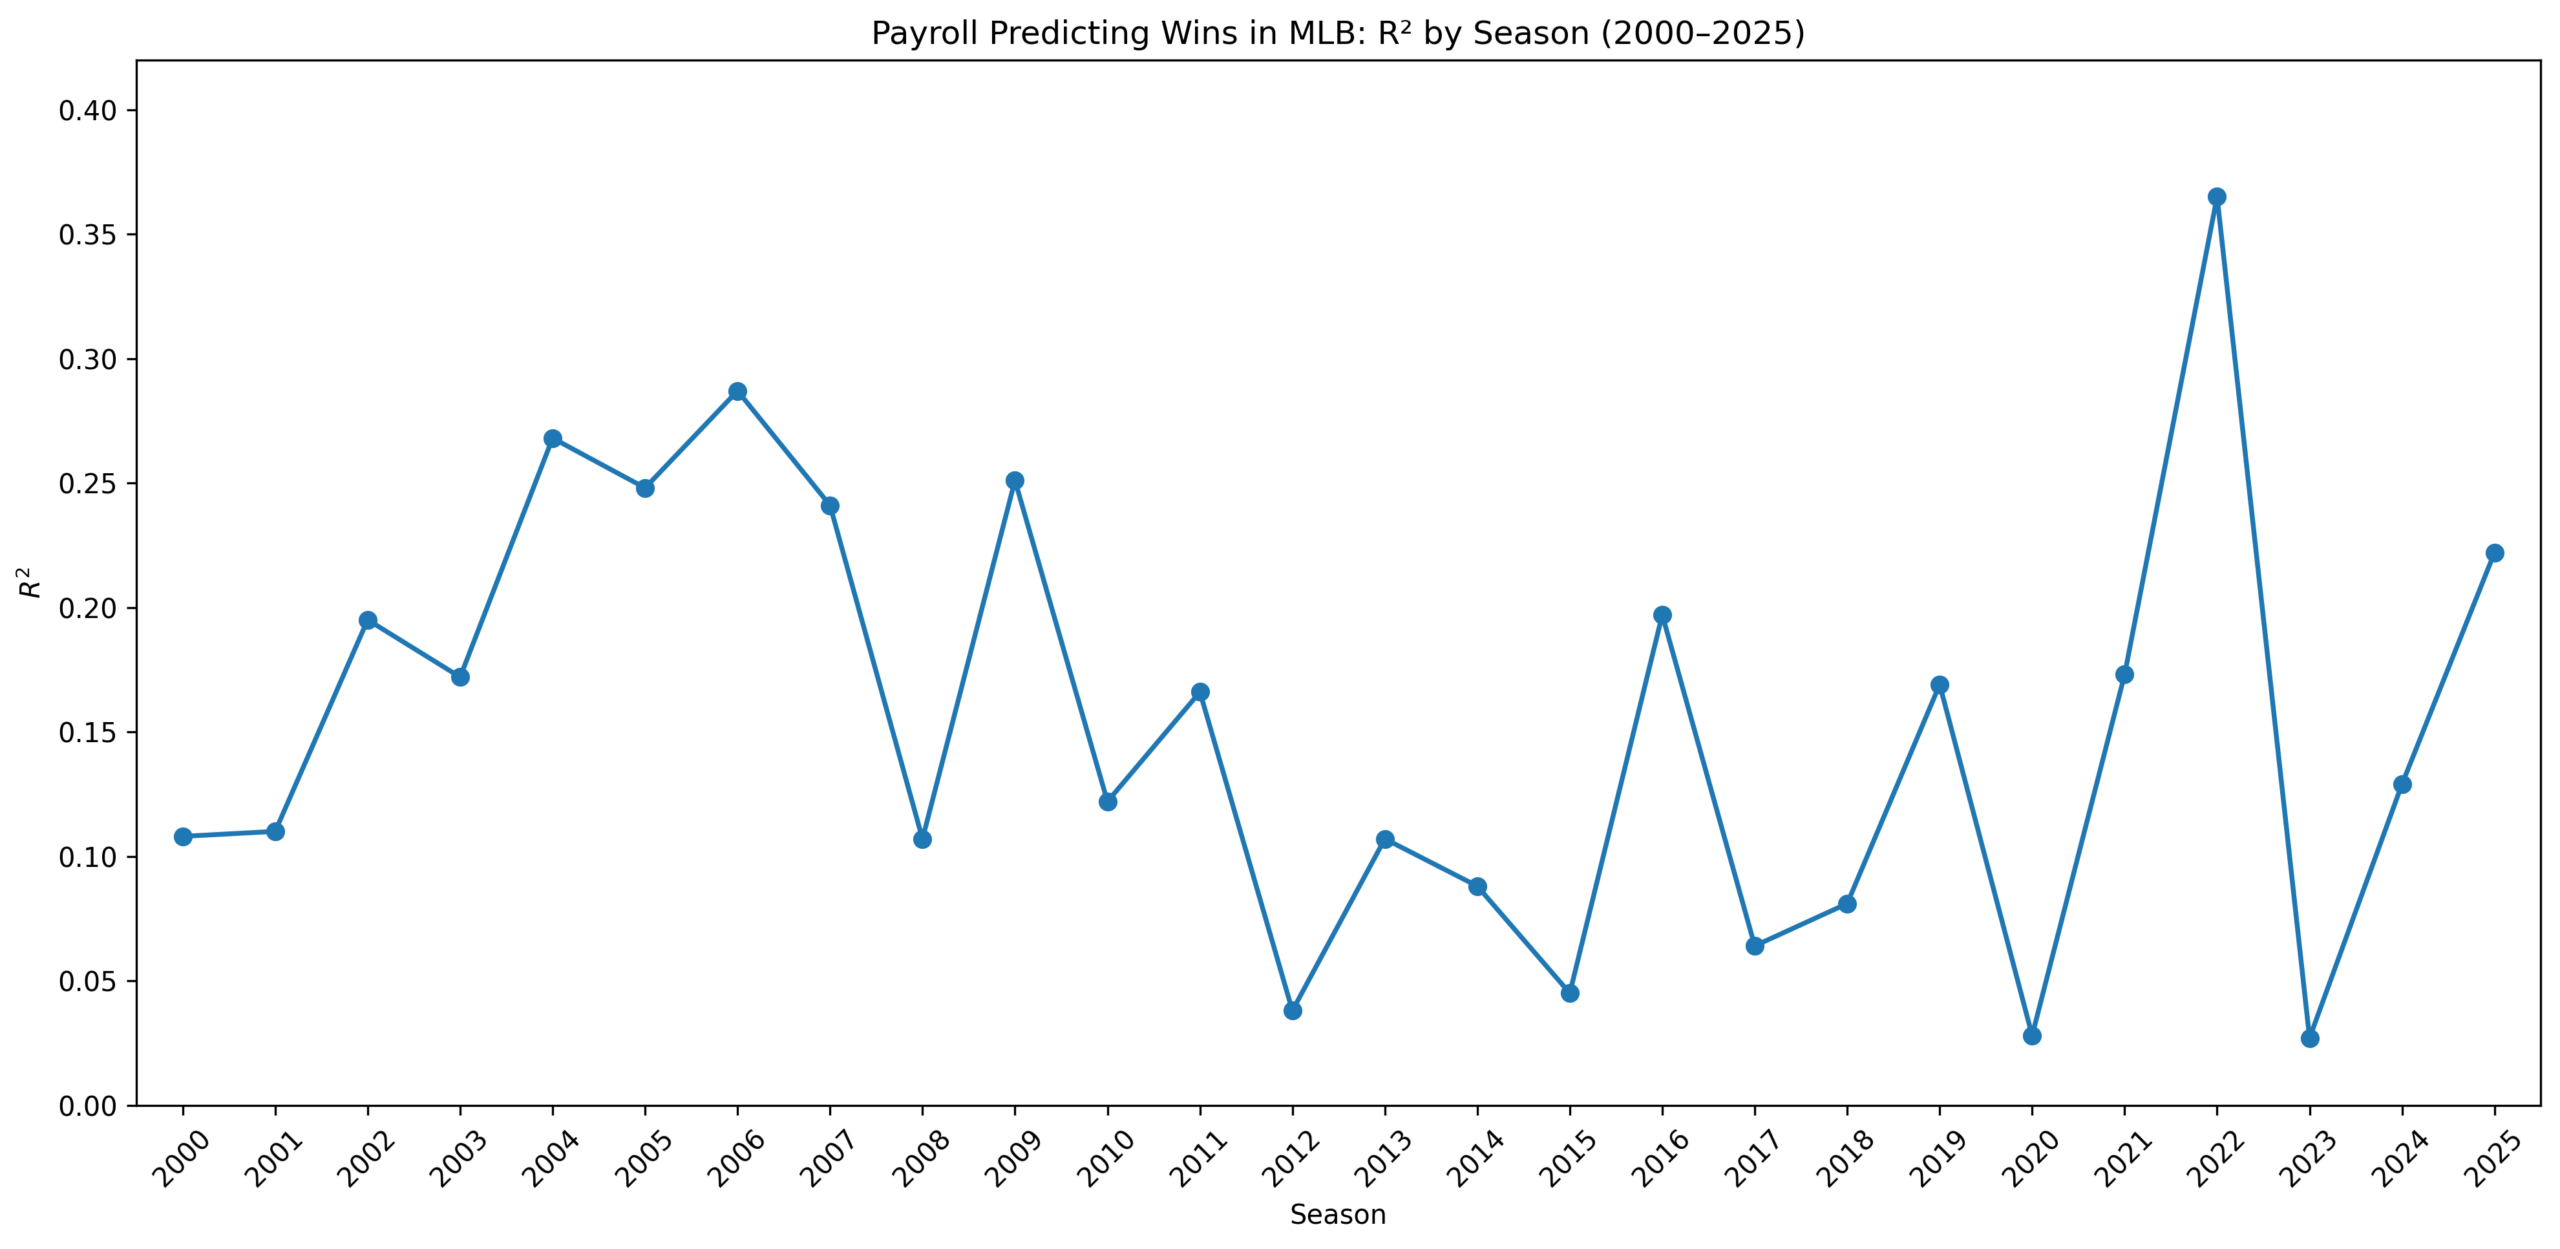
Figure 1: Payroll Predicting Wins in MLB, R² by Season, 2000–2025
The figure shows the year-by-year R² values from simple linear regressions of wins with respect to Opening Day payroll. Each season is treated separately. The result is a measure of how much of that year’s win variation can be explained by payroll alone.
The first thing that stands out is the instability. This is not a smooth upward line. It is not a story where money gradually takes over baseball. Instead, it is a jagged series of partial explanations.
Some years, payroll matters a lot. Some years, it barely matters at all.
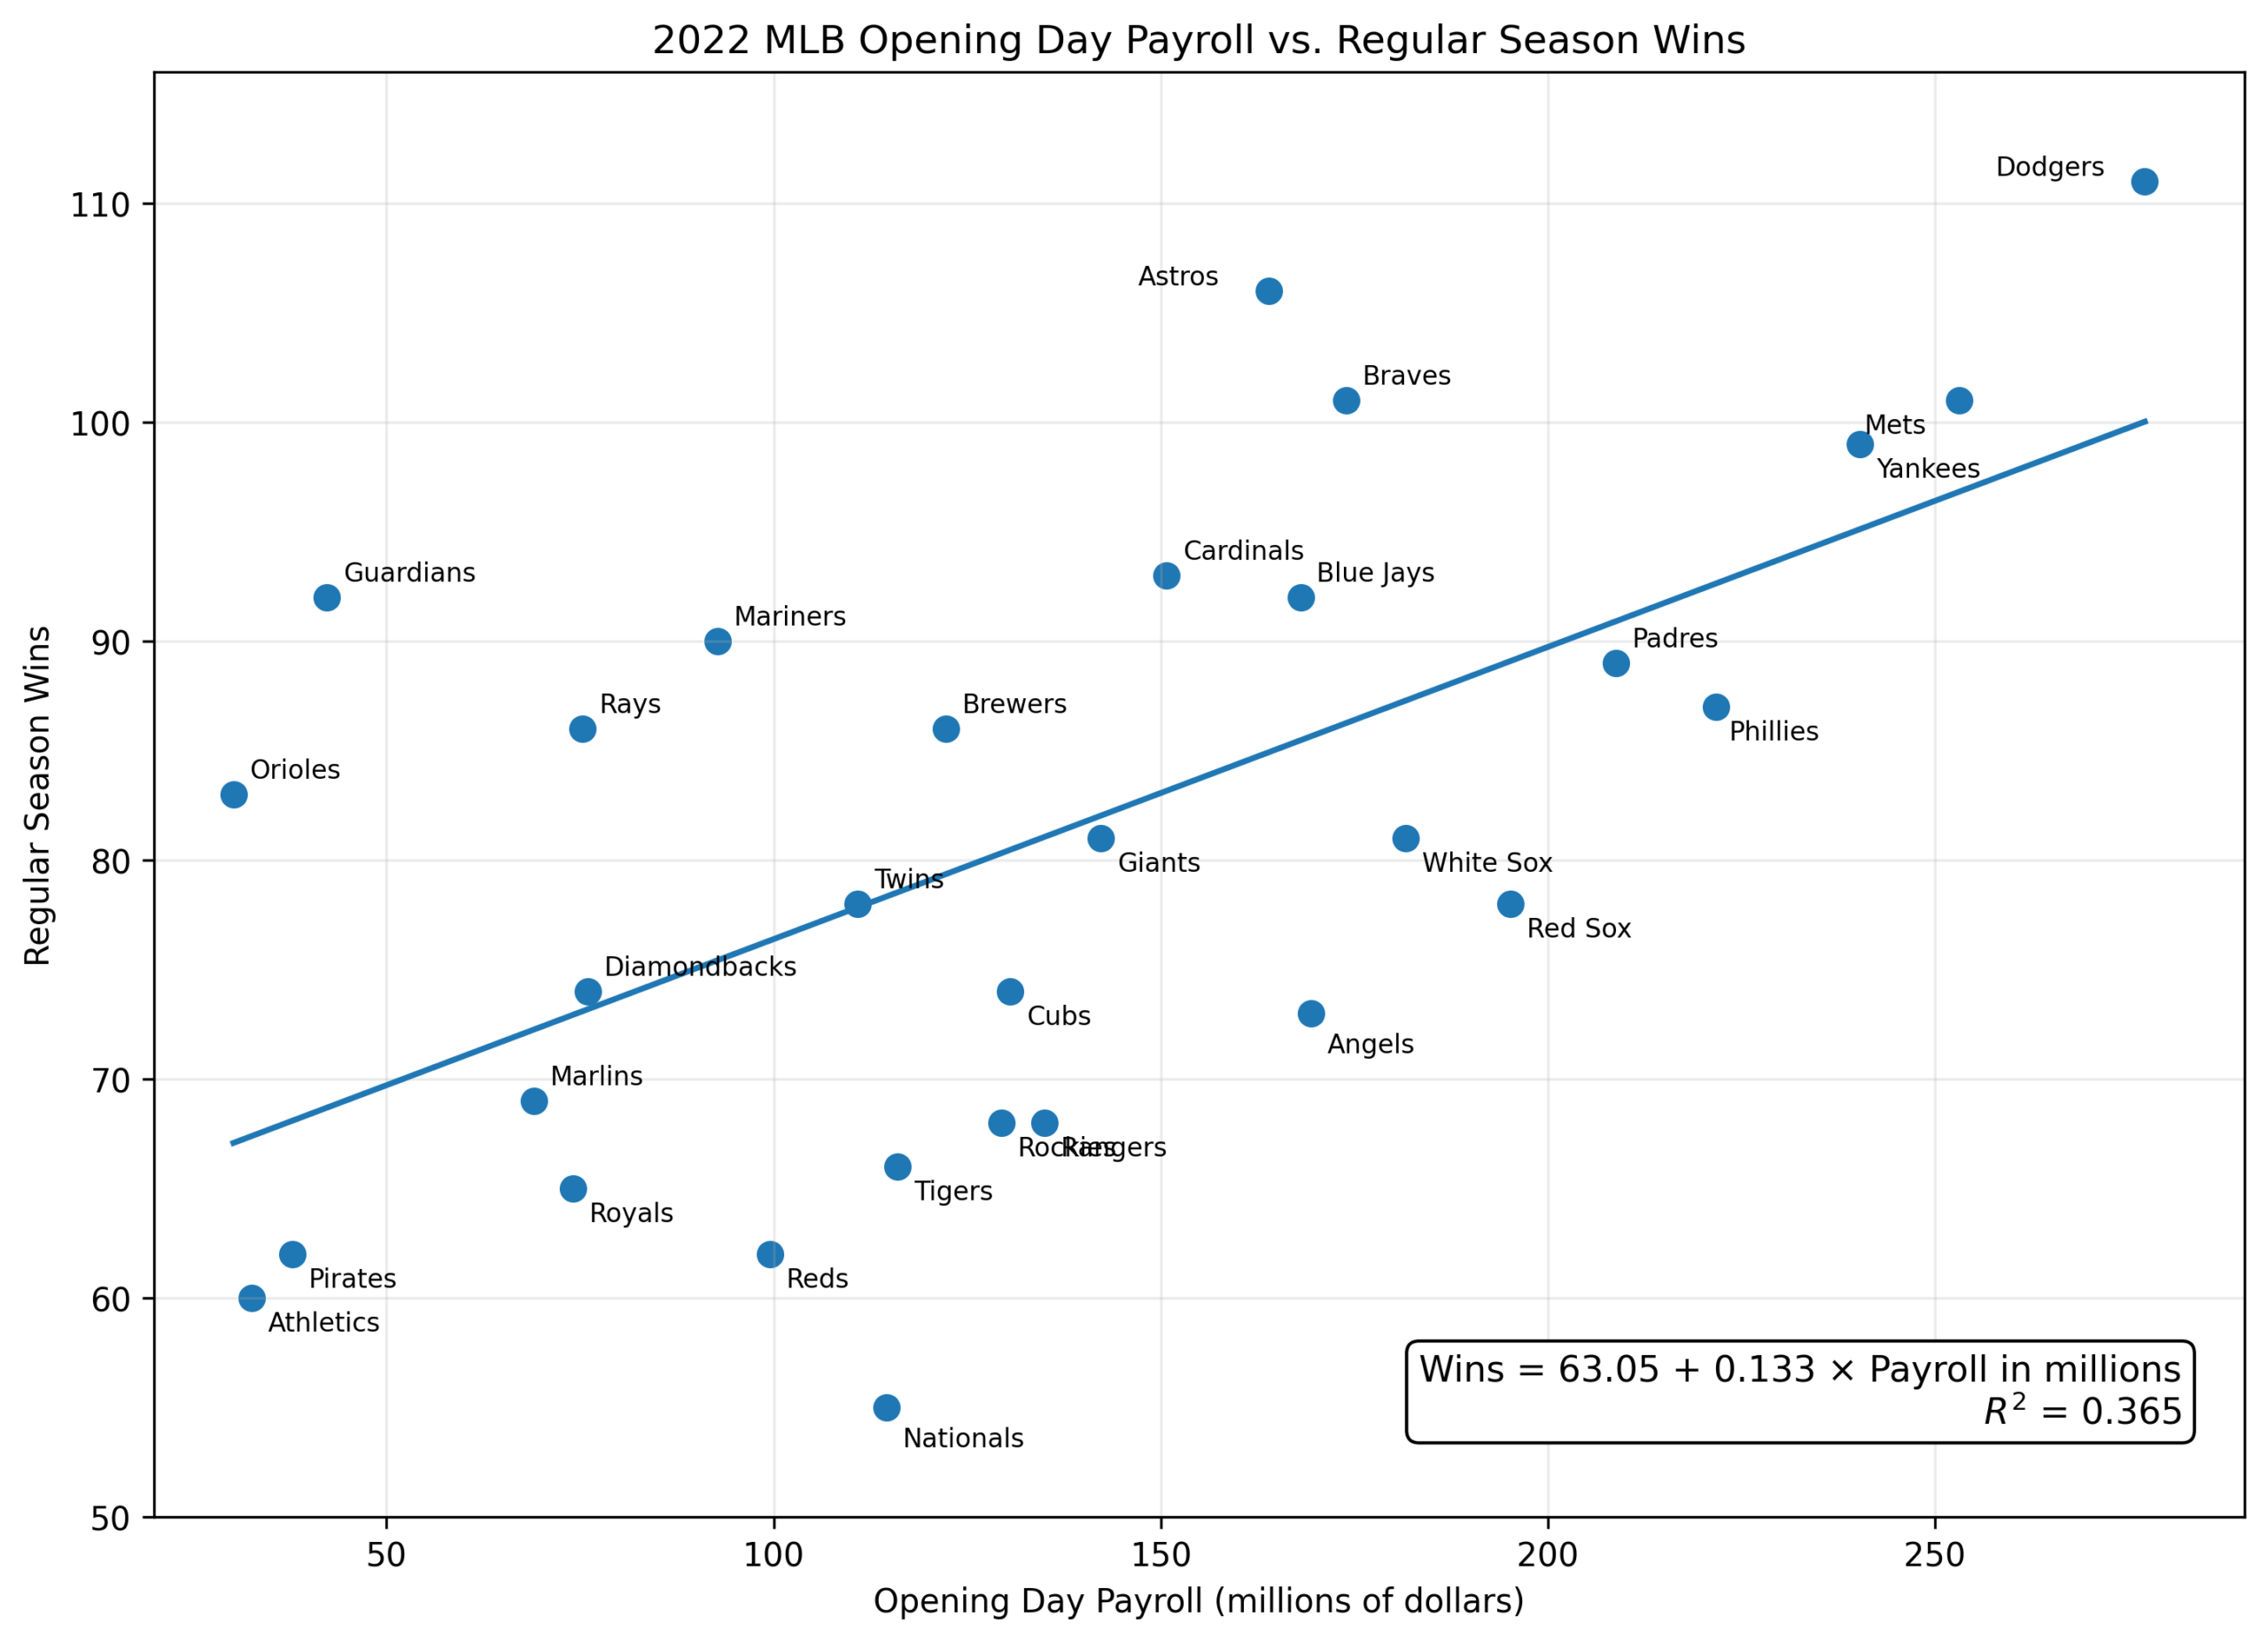
Figure 2: Payroll Predicting Wins in MLB, 2022
The high point in this series is 2022, with an R² of 0.365. That means payroll explained about 36.5% of the variation in wins that season. That is a substantial relationship by baseball standards.
And 2022 makes sense. The high-payroll teams mostly played like high-payroll teams would expect to. The Dodgers won 111 games. The Astros won 106. The Mets and Braves each won 101. The Yankees won 99. The Padres and Phillies also reached the postseason. At the bottom, several low-payroll clubs struggled badly: the Nationals, Athletics, Pirates, Reds, and Royals. The league sorted itself in a way that made payroll look highly predictive.
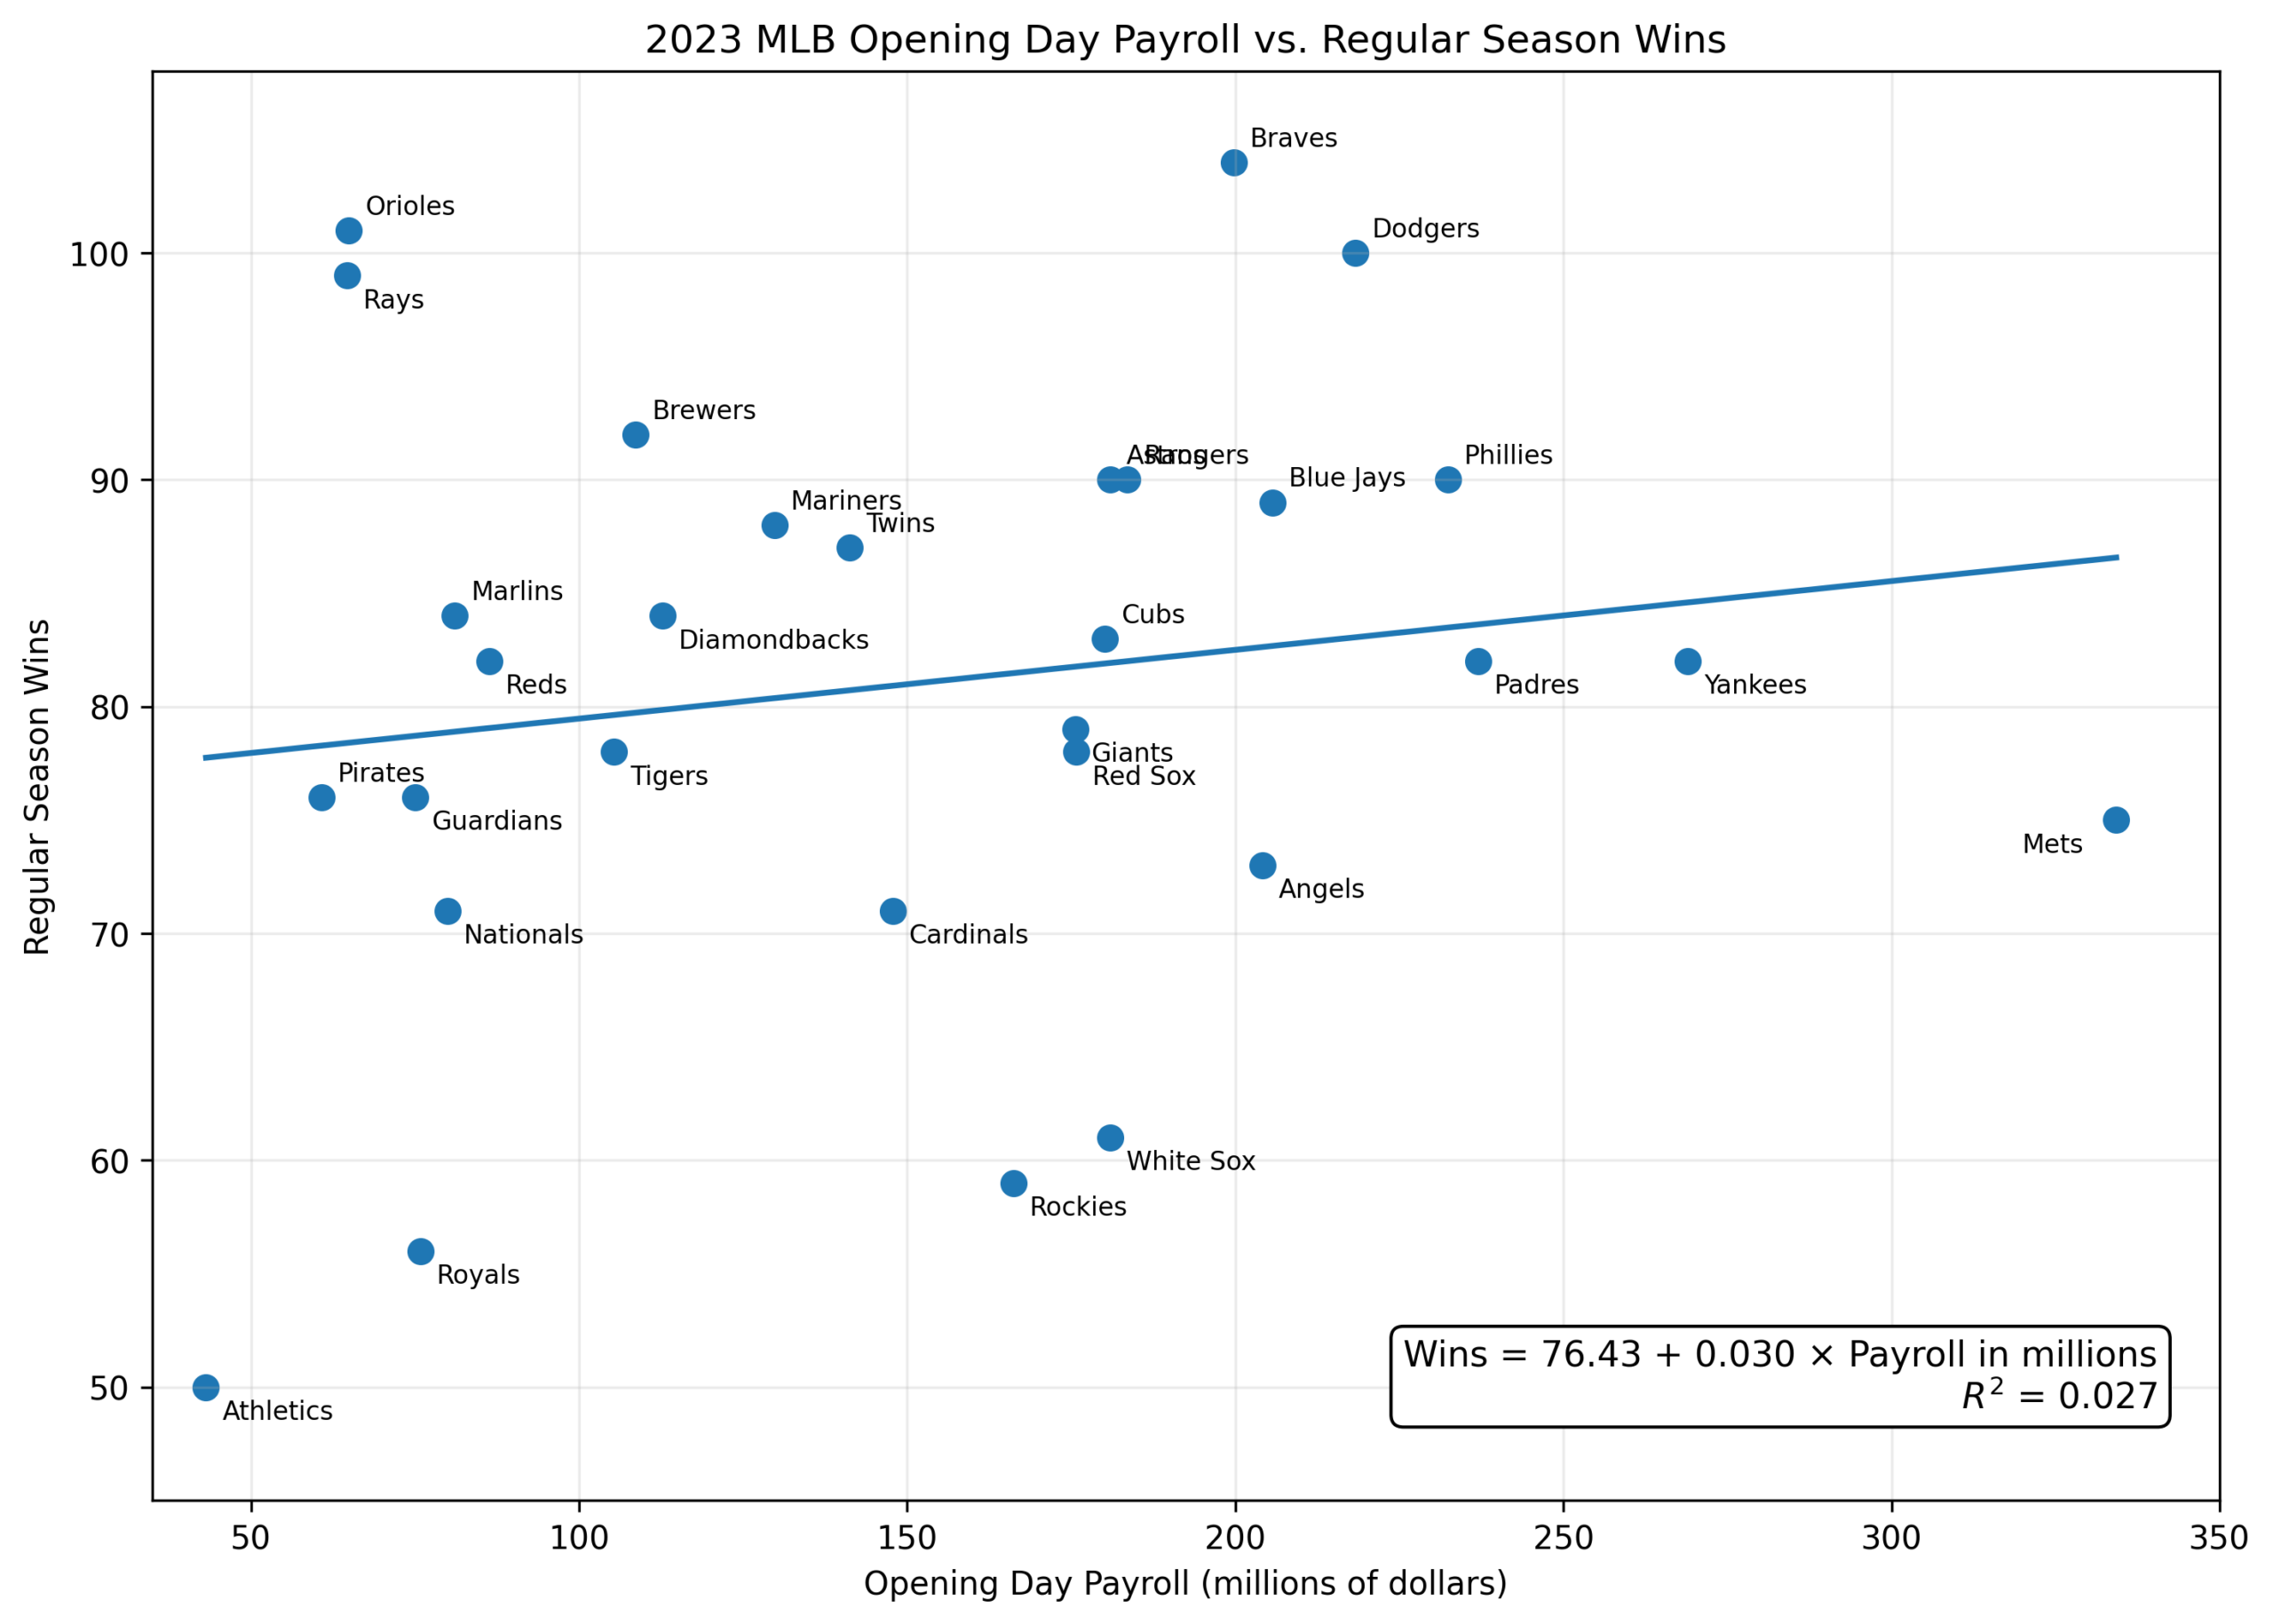
Figure 3: Payroll Predicting Wins in MLB, 2023
Then came 2023. Take a good look at the figure, and you will see it looks different from the 2022 data. The R² collapsed to 0.027.
That is close to zero, indicating there is virtually no relationship between payroll and wins.
This is the most fascinating turn in the whole study. From one year to the next, payroll went from explaining more than a third of win variation to explaining less than 3%.
Why? Because 2023 broke the payroll model. The Mets spent heavily and won only 75 games. The Yankees won 82. The Padres won 82. The Angels won 73. The Cardinals won 71. Meanwhile, the Orioles won 101 games with a much smaller payroll. The Rays won 99. The Diamondbacks and Marlins both reached 84 wins. The Reds won 82.
In 2022, money and winning lined up. In 2023, they didn’t. That contrast may be the central finding.
Payroll pushes teams toward a certain range of outcomes, but it does not determine where they land. A high payroll gives a team more ways to solve problems. It does not guarantee that the solutions will work.
The other important pattern is the weak stretch from 2012 through 2018. During that period, payroll often had surprisingly little explanatory power. The R² values were mostly low:
2012: .038
2013: .107
2014: .088
2015: .045
2016: .197
2017: .064
2018: .081
That is a remarkable run. It suggests that during much of the 2010s, payroll alone was a poor predictor of regular-season wins. This was the mature analytics era. Front offices had become better at finding value, developing players, managing service time, building bullpens, and exploiting inefficiencies. The market was not perfectly efficient, but it was changing.
Then the relationship strengthened again from 2019 through 2022:
2019: .169
2020: .028
2021: .173
2022: .365
The shortened 2020 season complicates the story, but the surrounding years suggest a partial return of payroll power. One possible explanation is that the richest teams had learned to combine financial strength with analytical sophistication. In the early Moneyball period, efficiency sometimes worked against spending. By the late 2010s and early 2020s, the richest teams were often efficient too.
That may be the modern equilibrium. The market inefficiencies did not disappear. They became harder to monopolize.
The Dodgers, Yankees, Mets, Phillies, Braves, Astros, and Padres were not simply spending. They were spending within more sophisticated baseball operations. Money was no longer just buying accomplished players. It was buying depth, optionality, injury insurance, and a larger margin for error.
Still, the overall composite number remains modest. An average R² of 0.154 means that about 85% of the variation in wins was not explained by Opening Day payroll. That remaining space is where baseball lives.
It includes player development. Injuries. Aging curves. Breakout seasons. Bullpen volatility. Schedule effects. Defensive positioning. Farm systems. Luck in one-run games. Sequencing. Clubhouse decisions. Deadline trades. Prospects arriving ahead of schedule. Veterans flaming out suddenly. This is all part of the complicated and powerful mathematics of 162 games.
Payroll matters. But baseball resists being bought cleanly. Perhaps the better question is not whether money buys wins. It is whether money buys a higher probability of avoiding disaster.
The important point is that rich teams can fail, but they often fail from a higher starting point. Poor teams can succeed, but they usually need more things to go right. There is a thin margin of error. Payroll raises the floor more reliably than it raises the ceiling.
The 2023 season is the best reminder. A massive payroll could not save the Mets. It could not save the Padres from mediocrity. It could not turn the Angels into contenders. At the same time, Baltimore showed how a young, inexpensive core can overturn the model entirely.
Then, 2024 and 2025 moved back toward the middle. Payroll explained 12.9% of wins in 2024 and 22.2% in 2025. Not irrelevant. Not overwhelming.
That may be the honest conclusion of the whole study: Money matters in MLB, but its power is unstable.
It explains a meaningful slice of success, but only a slice. Some years it looks like a structural force. In other years, it looks almost irrelevant. The relationship rises and falls depending on whether high-payroll teams are competent, whether low-payroll teams are rebuilding or emerging, and whether baseball’s many uncertainties conspire to surprise.
The numbers do not support the simplest fan argument: that teams can simply buy their way to wins. But they also do not support the romantic opposite: that payroll does not matter.
The truth is more interesting. Payroll is one variable in a noisy, messy system. It is a resource; it creates possibilities. As for certainty, in Major League Baseball, there is no such thing.
![]()