Baseball has changed enormously since the middle of the twentieth century.
Strikeouts have increased. Home-run rates have risen and fallen. Stolen bases have moved in and out of fashion. Relief pitching has become more specialized. Defensive positions have acquired different offensive expectations.
It is tempting, therefore, to divide baseball history into a sequence of distinct player types. The contact hitter belongs to one era. The base stealer belongs to another. The modern game belongs to the power hitter who walks frequently and strikes out even more frequently.
But is that really what happened?
Did one type of hitter replace another, or did the same basic offensive archetypes persist across changing statistical environments?
To explore that question, I used the Lahman baseball database to examine 9,218 qualified non-pitcher seasons from 1954 through 2025. I standardized each player against other qualified hitters in his own season, reduced the statistical profiles using principal component analysis, and then used clustering to identify recurring offensive archetypes.
The results reveal six recognizable types of offensive players:
- Patient-contact hitters
- Low-impact contact hitters
- Elite power-and-patience hitters
- Power-and-strikeout hitters
- Aggressive free-swingers
- Speed-and-contact hitters
Perhaps most importantly, the results suggest that baseball’s statistical environment has changed much more dramatically than its underlying distribution of player types.
The modern hitter may look different in the raw statistics. Relative to his contemporaries, however, he often occupies a role that has existed for generations.
Building the Historical Sample
I began with five Lahman tables:
- Batting
- People
- Appearances
- Fielding
- Teams
Players who appeared for multiple teams during one season were combined into a single player-season record. I used the appearances data to assign each player a primary defensive position, defined as the position at which he appeared most frequently during that season.
Pitchers were excluded.
To account for seasons of different lengths, I defined a qualified season using the familiar standard of 3.1 plate appearances per scheduled team game.
Because teams occasionally played slightly different numbers of games, I used the median number of team games during each season:
PA_{i,y} \geq 3.1 \widetilde{G}_{y}where:
\widetilde{G}_{y} = \operatorname{median}\left(G_y\right)Here, (\widetilde{G}_{y}) represents the median number of team games played in season (y).
This method adjusts the qualification threshold for 154-game seasons, 162-game seasons, strike-shortened seasons, and the 60-game 2020 season.
The study begins in 1954 because the variables needed for the full model are not consistently complete before that date. Strikeouts become sufficiently complete before then, but caught stealing and sacrifice flies create additional limitations. Beginning in 1954 allows the same five-variable model to be used across the entire study period.
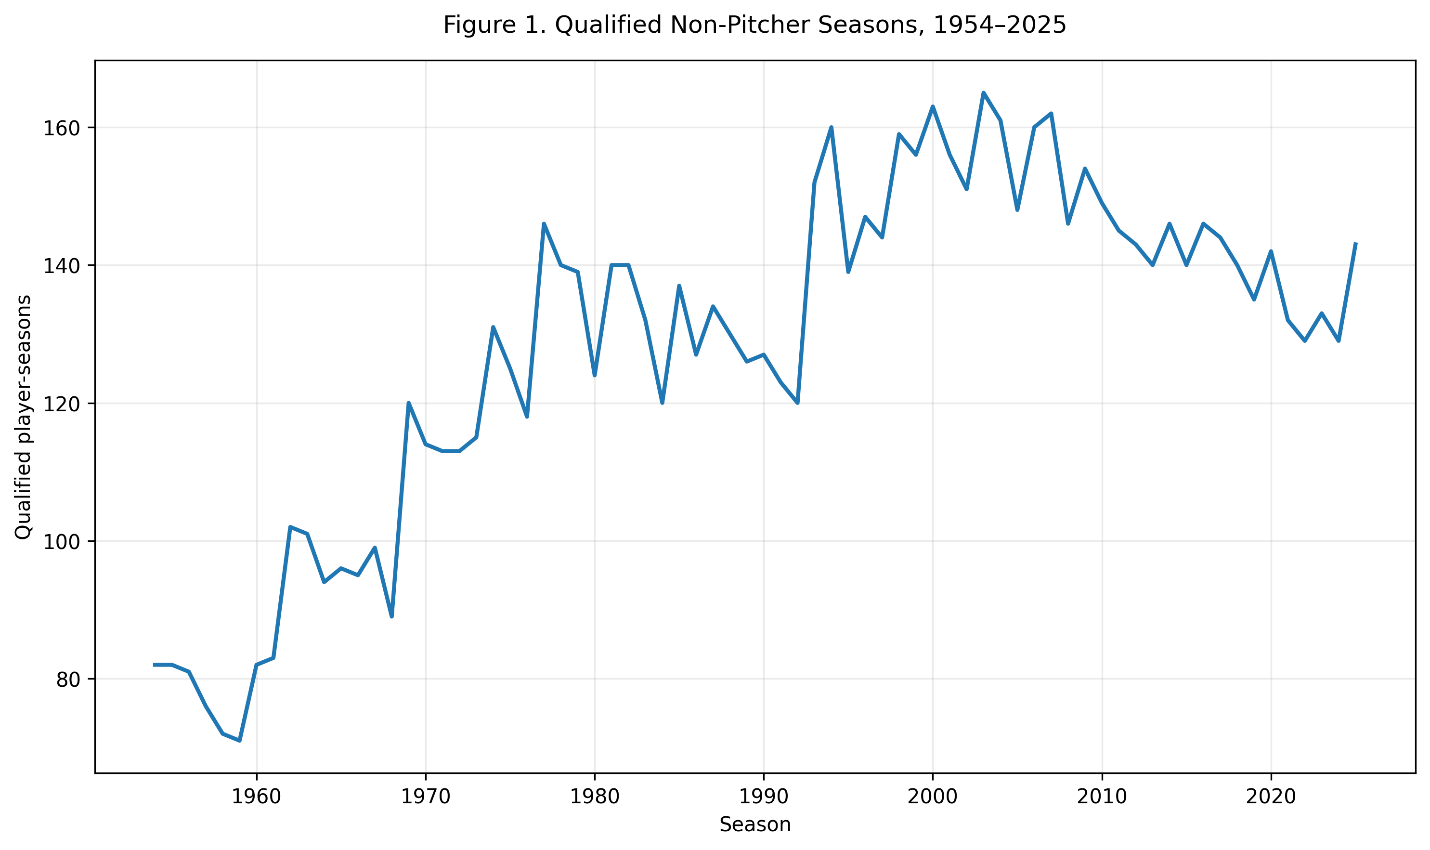
Figure 1. The number of qualified player-seasons generally increased as Major League Baseball expanded.
The increase in qualified seasons primarily reflects league expansion. The early portion of the study contains fewer than 100 qualified hitters in many seasons. By the late 1990s and early 2000s, the total frequently exceeded 150.
Measuring an Offensive Profile
I wanted to describe how a hitter produced offense, not merely how much offense he produced.
I therefore selected five variables:
- On-base percentage
- Isolated power
- Walks per plate appearance
- Strikeouts per plate appearance
- Net stolen bases per plate appearance
Plate appearances were calculated as:
PA = AB + BB + HBP + SF + SHOn-base percentage was calculated as:
\mathrm{OBP} = \frac{ H + BB + HBP }{ AB + BB + HBP + SF }Isolated power measures extra-base power beyond batting average:
\mathrm{ISO} = \mathrm{SLG} - \mathrm{AVG}The walk and strikeout rates were:
\mathrm{BB/PA} = \frac{BB}{PA} \mathrm{SO/PA} = \frac{SO}{PA}Finally, I defined net stolen-base production as:
\mathrm{NetSB/PA} = \frac{ SB - CS }{ PA }This final measure rewards successful steals while penalizing caught-stealing events.
I did not include runs or RBI in the clustering model. Both statistics are strongly affected by batting order, teammates, and opportunity. They tell us something about the results of a player’s season, but less about the underlying style with which he produced those results.
Home runs were also not included as a separate rate because ISO already captures power production. Adding both ISO and home runs per plate appearance would have given power disproportionate weight in the clustering.
Baseball’s Changing Offensive Environment
The raw statistics immediately demonstrate how much the offensive environment changed.
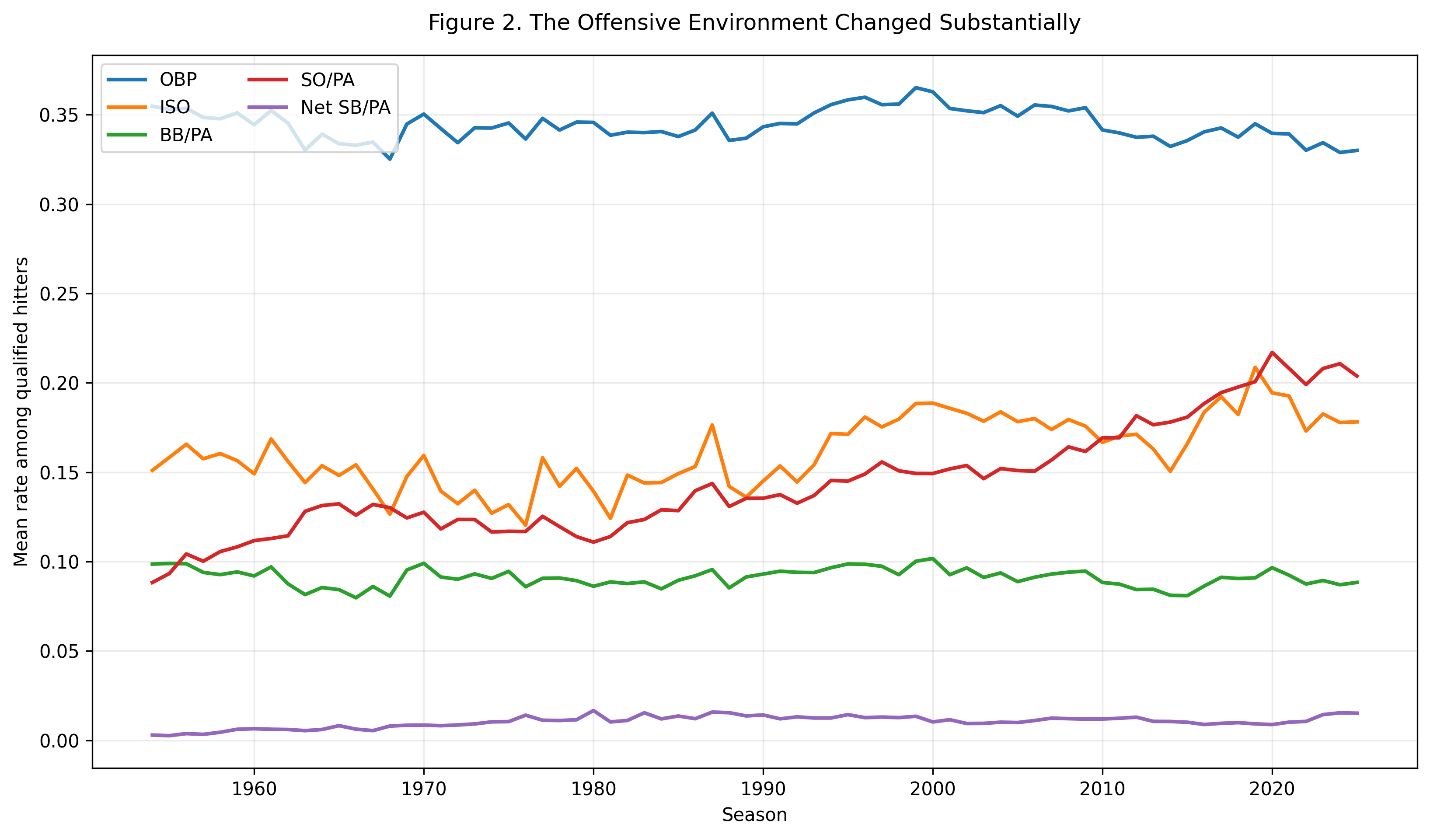
Figure 2. Mean offensive rates among qualified hitters, 1954-2025.
In 1954, the average qualified hitter in the sample had approximately:
\mathrm{OBP} = 0.355 \mathrm{ISO} = 0.151 \mathrm{SO/PA} = 0.088By 2025, the corresponding values were approximately:
\mathrm{OBP} = 0.330 \mathrm{ISO} = 0.178 \mathrm{SO/PA} = 0.204The average qualified hitter’s strikeout rate more than doubled.
Power generally increased, particularly during the offensive surge of the late 1990s and again during the home-run-heavy seasons of the late 2010s. Walk rates changed much less. On-base percentage remained within a fairly narrow historical range, although it rose noticeably around 2000 before declining.
Stolen-base production followed a different pattern. It increased during the 1970s and 1980s, declined during the power-oriented environment that followed, and has recently begun to rise again.
These changes create a serious comparison problem. A 20 percent strikeout rate would have been extraordinary during much of the twentieth century. In the modern game, it may be close to ordinary.
A player cannot be classified historically based solely on raw statistics.
Adjusting Every Player for His Era
To make the seasons comparable, I standardized each variable within its own season.
For player (i), season (y), and offensive measure (m):
z_{i,y,m} = \frac{ x_{i,y,m} - \overline{x}_{y,m} }{ s_{y,m} }A value of: z=0 indicates that the player was equal to the seasonal average.
A value of: z=1 indicates that he was one standard deviation above the seasonal average.
This adjustment alters the analysis’s meaning. I am not asking whether a hitter had a high strikeout rate in absolute terms. I am asking whether he struck out frequently compared with the other qualified hitters of his own season.
A player from 1965 and a player from 2025 can therefore belong to the same archetype even though their raw statistics differ substantially.
They occupied the same relative position within their respective baseball environments.
Reducing the Offensive Dimensions
The five standardized variables remain related to one another. High-OBP players often walk frequently. Power hitters may also strike out frequently. Speed-oriented players tend to have different power and contact profiles.
I used principal-component analysis to summarize these relationships.
The first principal component explained: 42.5% of the total variation.
The second explained: 25.0%. Together, the first two components explained: 42.5% +25.0% = 67.5%
The first three components explained approximately: 86.2% of the total variation.
The first component primarily represents overall offensive force. OBP, ISO, and walk rate all load positively on this dimension. Players far to the right of the PCA plot tend to reach base, hit for power, and draw walks at rates well above their seasonal environments.
The second component separates high-power, high-strikeout hitters from lower-strikeout players with stronger contact or speed characteristics.
How Many Archetypes Are There?
Clustering always requires a choice about how much detail to preserve.
A model with too few clusters combines meaningfully different players. A model with too many clusters produces distinctions that may be statistically fragile or difficult to interpret.
The k-means procedure attempts to minimize the total squared distance between each player and the center of his assigned cluster:
\mathrm{WCSS} = \sum_{k=1}^{K} \sum_{i \in C_k} \left\lVert \mathbf{z}_i - \boldsymbol{\mu}_k \right\rVert^2where:
C_k=\mathrm{cluster}\ k\mathbf{z}_i = \mathrm{standardized\ profile\ of\ player\!-\!season}\ i
\boldsymbol{\mu}_{k} = \mathrm{center\ of\ cluster}\ kI tested solutions containing four through nine clusters.
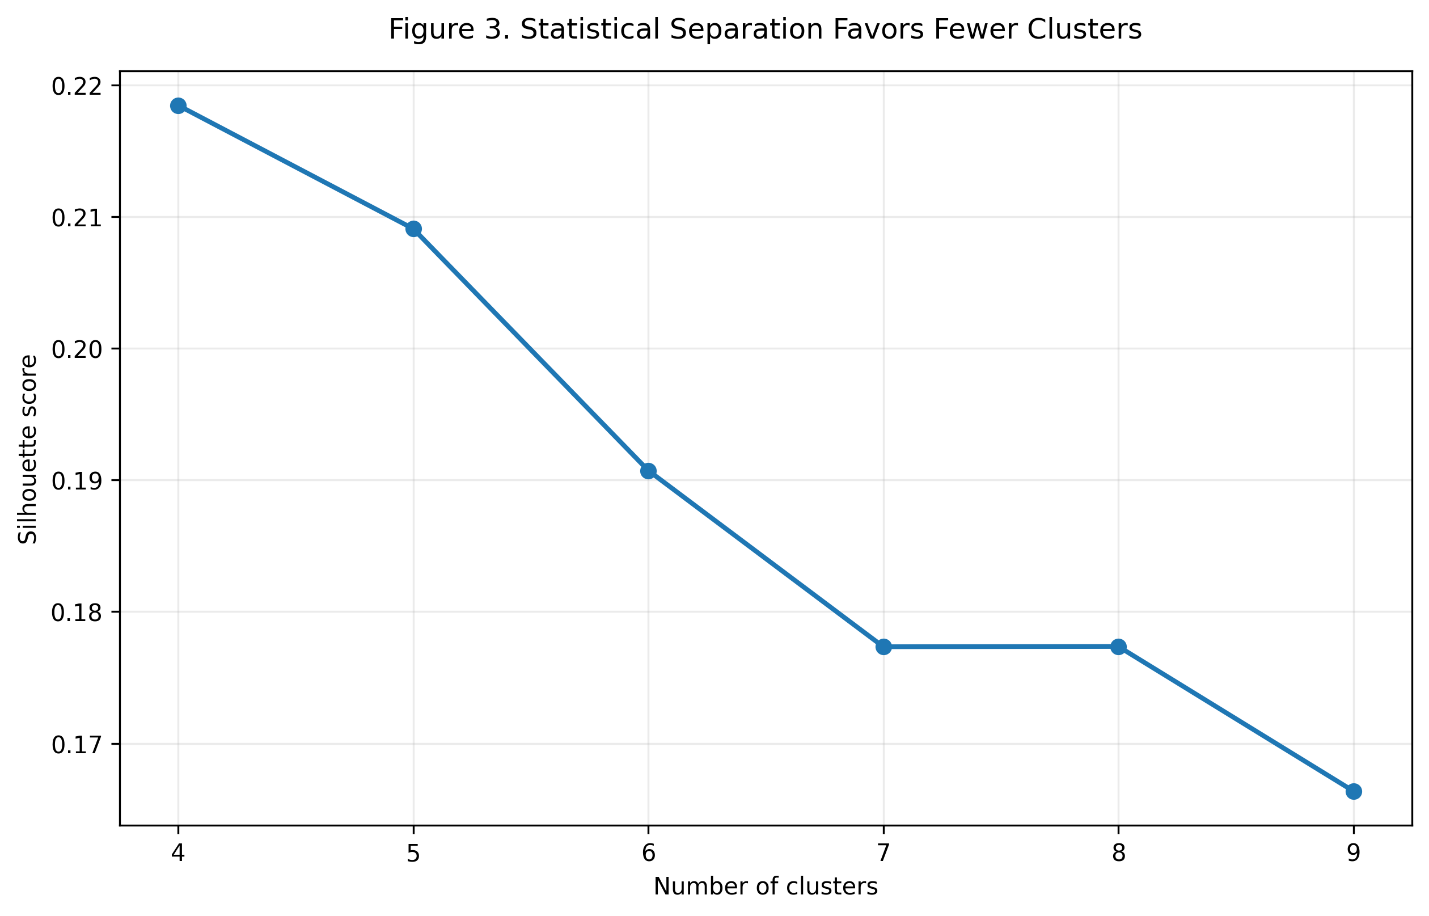
Figure 3. The silhouette score is highest for the four-cluster model, although the six-cluster model retains useful baseball distinctions.
The silhouette statistic compares the average distance between a player and his own cluster with the distance between that player and the nearest alternative cluster:
s(i) = \frac{ b(i)-a(i) }{ \max\left\{a(i),b(i)\right\} }The four-cluster solution produced the strongest formal separation. However, it merged several historically meaningful offensive styles.
In particular, it tended to combine elite power-and-patience hitters with less complete power hitters, and it reduced distinctions between contact-oriented players.
I therefore selected the six-cluster solution.
This is an interpretive decision. The six clusters are not six perfectly isolated biological species. Baseball players exist along continuous statistical dimensions. The purpose of the clusters is to provide a useful map of that continuum.
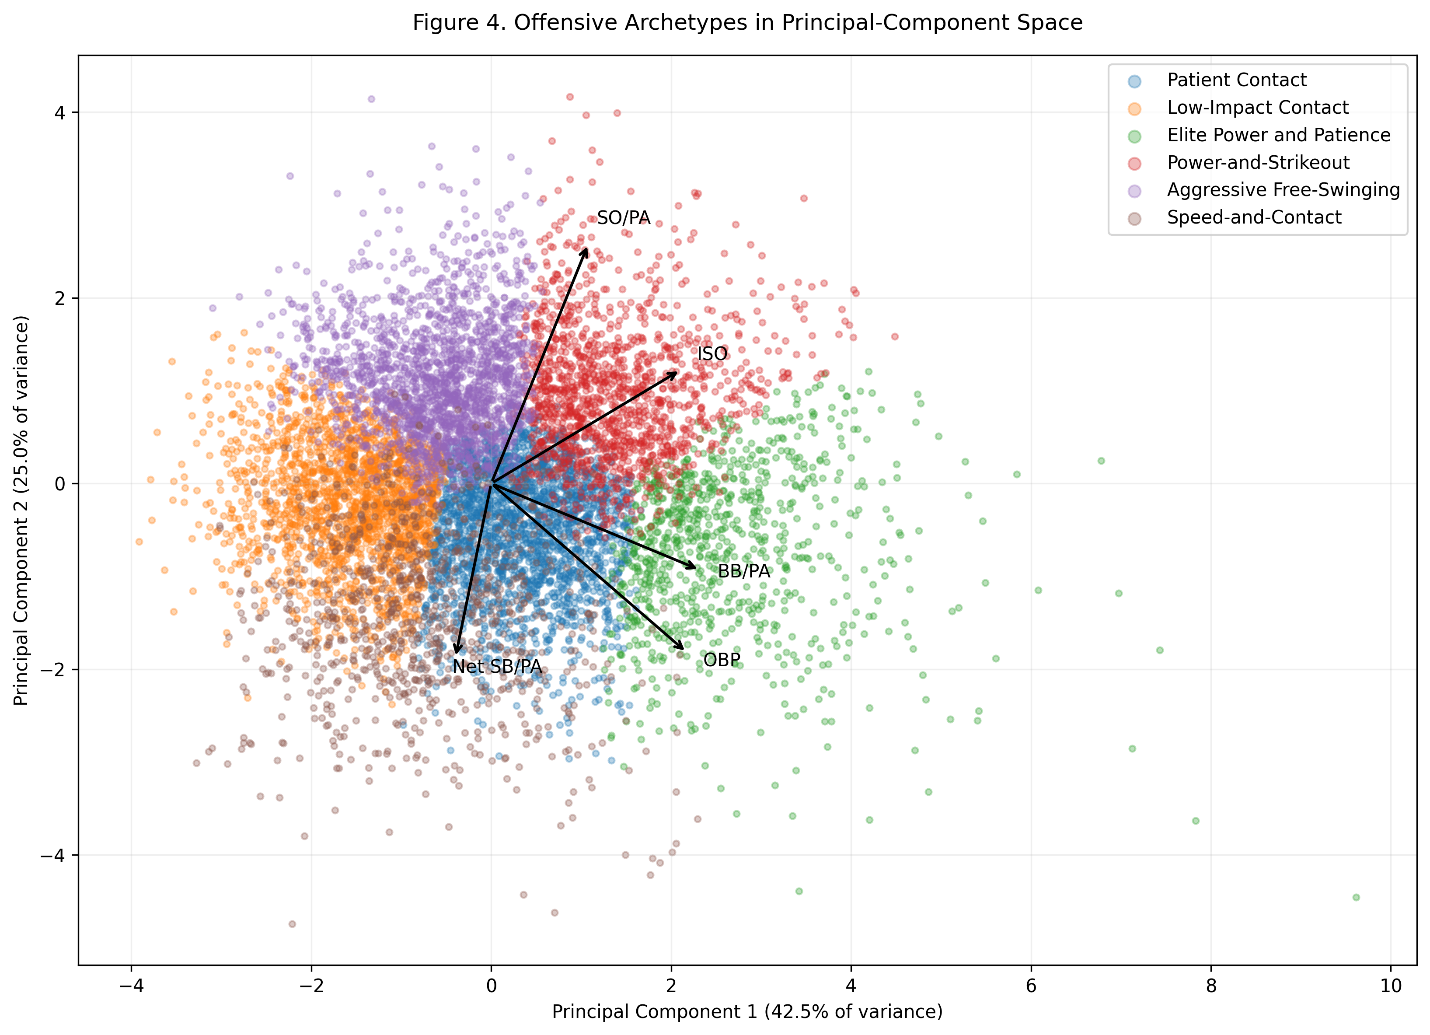
Figure 4. The 9,218 player-seasons displayed in the space formed by the first two principal components.
The overlap in Figure 4 is important. The clusters are recognizable, but their boundaries are not absolute. A player near a boundary may resemble members of two neighboring archetypes.
The Six Offensive Archetypes
Figure 5 shows the standardized center of each cluster.
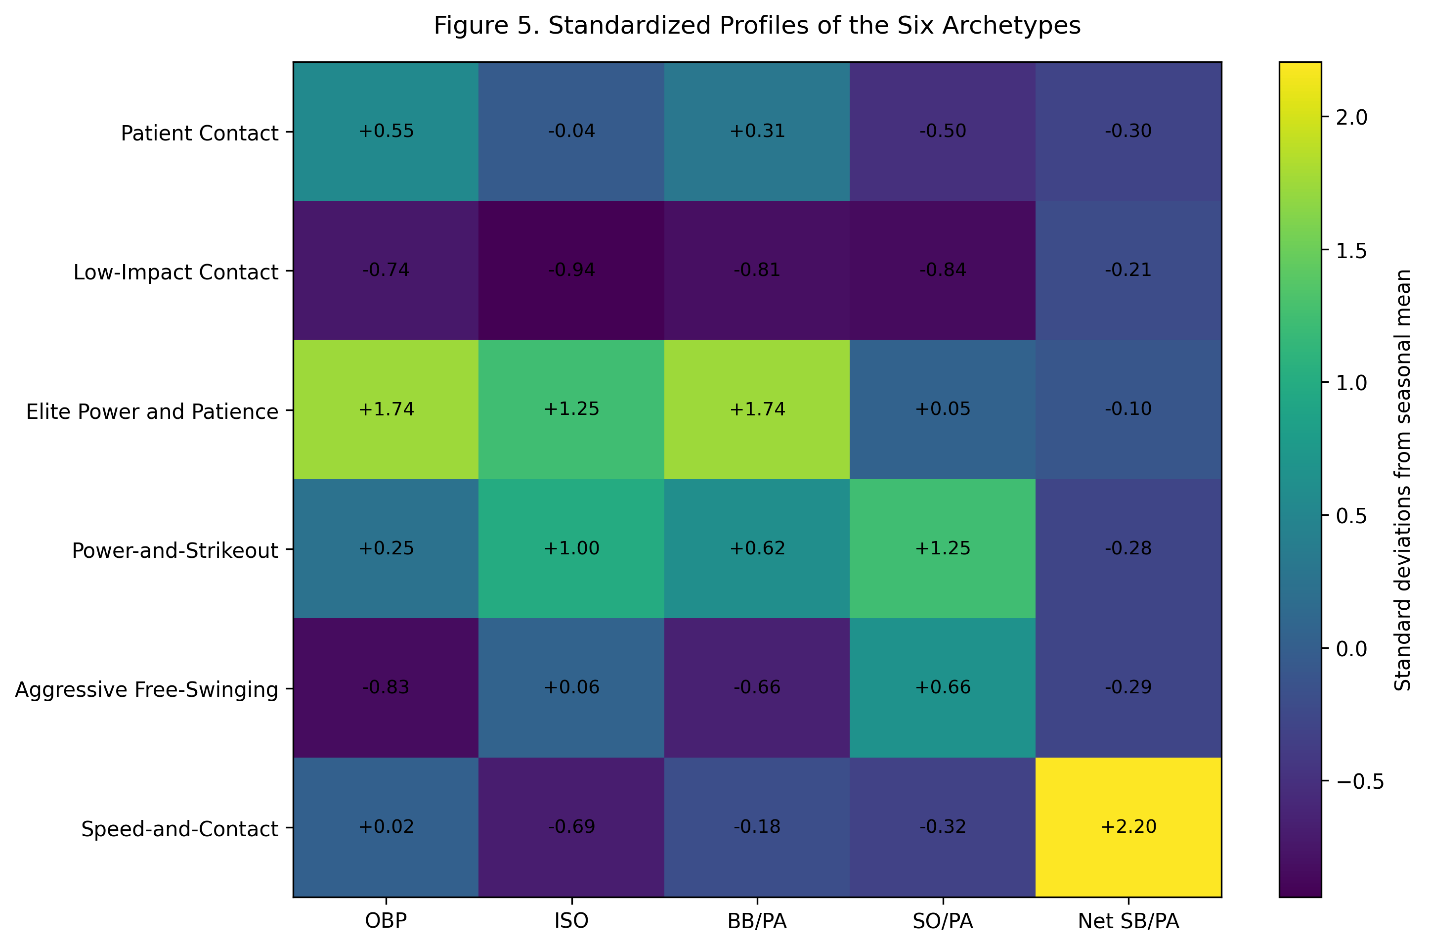
Figure 5. Each value represents the number of standard deviations above or below the seasonal mean.
1. Patient-Contact Hitters
Player-seasons: 2,190
Share of sample: 23.8 percent
The patient-contact group combines:
- Above-average OBP
- Above-average walk rates
- Low strikeout rates
- Approximately average power
- Below-average stolen-base production
Its cluster center has an OBP score of:
z_{\mathrm{OBP}} = +0.55and a strikeout-rate score of:
z_{\mathrm{SO/PA}} = -0.50These hitters generally controlled the strike zone and put the ball in play. They were not necessarily powerless, but power was not the defining feature of the group.
The most statistically central examples include:
- Justin Turner, 2022
- Eric Hosmer, 2015
- Edgardo Alfonzo, 1999
These are not necessarily the greatest seasons in the cluster. They are the seasons located closest to its statistical center.
2. Low-Impact Contact Hitters
Player-seasons: 1,925
Share of sample: 20.9 percent
This group also struck out infrequently, but without the OBP, walks, or power of the patient-contact cluster.
Its center was:
z_{\mathrm{OBP}} = -0.74 z_{\mathrm{ISO}} = -0.94 z_{\mathrm{BB/PA}} = -0.81 z_{\mathrm{SO/PA}} = -0.84These hitters made contact, but much of that contact produced limited offensive value. Their low strikeout rates should not automatically be interpreted as evidence of superior hitting.
This distinction is important. Avoiding strikeouts is valuable only when the resulting balls in play produce enough hits, power, or advancement to compensate for the lost walks and extra-base production.
Central examples include:
- Danny Bautista, 2004
- Marlon Anderson, 2002
- Melky Cabrera, 2007
3. Elite Power-and-Patience Hitters
Player-seasons: 851
Share of sample: 9.2 percent
This is the smallest cluster and the most offensively dominant.
Its center was approximately:
z_{\mathrm{OBP}} = +1.74 z_{\mathrm{ISO}} = +1.25 z_{\mathrm{BB/PA}} = +1.74The cluster’s strikeout rate was almost exactly average relative to each season:
z_{\mathrm{SO/PA}} = +0.05These hitters combined elite on-base ability with elite power and patience. Unlike the power-and-strikeout group, they did not require an exceptionally high strikeout rate to produce their power.
Central examples include:
- Al Kaline, 1966
- Kris Bryant, 2017
- Ben Zobrist, 2009
The presence of players from widely separated eras is exactly what the season adjustment was designed to reveal. Their raw strikeout totals and league environments differed, but their relative offensive structures were similar.
4. Power-and-Strikeout Hitters
Player-seasons: 1,363
Share of sample: 14.8 percent
This group most closely resembles the familiar three-true-outcomes hitter.
Its defining characteristics were:
z_{\mathrm{ISO}} = +1.00 z_{\mathrm{BB/PA}} = +0.62 z_{\mathrm{SO/PA}} = +1.25The group produced power and drew walks, but also struck out much more frequently than its seasonal peers.
Its OBP remained modestly above average:
z_{\mathrm{OBP}} = +0.25Central examples include:
- Jack Clark, 1979
- Andruw Jones, 2002
- Dale Murphy, 1986
This cluster existed long before the recent explosion in league-wide strikeouts. The modern environment made the raw statistical profile more common, but the relative archetype was already present.
5. Aggressive Free-Swingers
Player-seasons: 1,946
Share of sample: 21.1 percent
The aggressive free-swinging group had:
- Below-average OBP
- Below-average walk rates
- Above-average strikeout rates
- Approximately average power
- Little baserunning contribution
Its center included:
z_{\mathrm{OBP}} = -0.83 z_{\mathrm{BB/PA}} = -0.66 z_{\mathrm{SO/PA}} = +0.66Power was only slightly above the seasonal average:
z_{\mathrm{ISO}} = +0.06This is an important contrast with the power-and-strikeout cluster. Both groups struck out frequently, but the aggressive free-swingers did not receive the same compensating power, walks, or OBP.
Central examples include:
- Ollie Brown, 1969
- Ryan Ludwick, 2009
- Matt Williams, 1998
6. Speed-and-Contact Hitters
Player-seasons: 943
Share of sample: 10.2 percent
This was the most specialized cluster.
Its net stolen-base score was:
z_{\mathrm{NetSB/PA}} = +2.20No other cluster approached that level.
The group also had:
z_{\mathrm{SO/PA}} = -0.32and:
z_{\mathrm{ISO}} = -0.69These players produced value through speed, contact, and mobility rather than power.
Central examples include:
- Delino DeShields, 2000
- Stan Javier, 1995
- Marquis Grissom, 1994
Their average OBP was almost exactly equal to the seasonal mean. The cluster was not defined by superior hitting in the narrow sense. A distinctive combination of speed, contact, and limited power defined it.
Did the Archetypes Change Over Time?
This was the study’s central question.
The raw offensive environment changed dramatically. Figure 2 shows a major increase in strikeout rates, higher power levels, and shifting patterns of stolen bases.
The relative distribution of player archetypes was surprisingly stable.
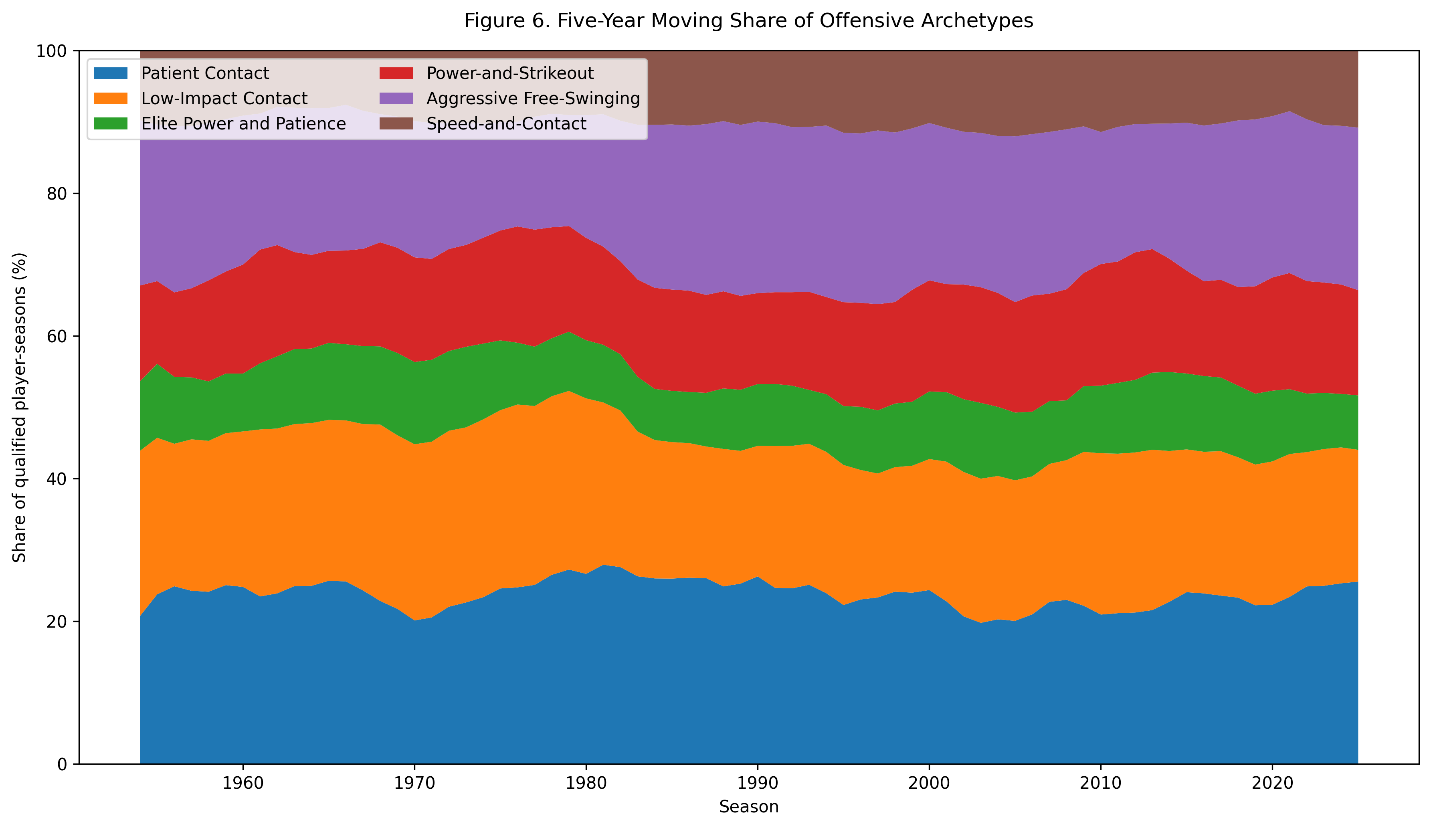
Figure 6. Five-year moving percentages of qualified player-seasons assigned to each cluster.
Patient-contact hitters generally represented between approximately 20 and 28 percent of qualified seasons.
Low-impact contact hitters reached their highest levels during the 1960s and 1970s, then gradually declined. Their five-year moving share peaked near 26 percent in the mid-1970s and stood near 19 percent by 2025.
Power-and-strikeout hitters became somewhat more prevalent, reaching approximately 18 percent around 2012. Yet they never displaced the other archetypes.
Speed-and-contact hitters remained surprisingly consistent. Their moving share generally remained between approximately 8 and 12 percent, even though league-wide stolen-base environments changed considerably.
The elite power-and-patience group remained rare throughout the entire study. It accounted for approximately 8 to 11 percent of qualified seasons in most periods.
The 2020s did not produce a completely new distribution of player types. Compared with the partial 1950s sample, the modern distribution contains somewhat fewer low-impact contact hitters and a modestly larger share of power-and-strikeout hitters.
The basic architecture, however, remains recognizable.
This suggests that baseball evolution has operated on at least two levels.
At the first level, the statistical baseline changes. Strikeouts become more common. Power becomes more valuable. Stolen-base strategies change.
At the second level, players continue to occupy recurring roles relative to that baseline. Every era still contains:
- Patient hitters
- Free swingers
- Power hitters
- Speed specialists
- Low-impact contact hitters
- Rare players who combine several elite skills
The numbers change. The ecological niches persist.
Offensive Archetypes and Defensive Positions
The clusters were also closely connected to defensive position.
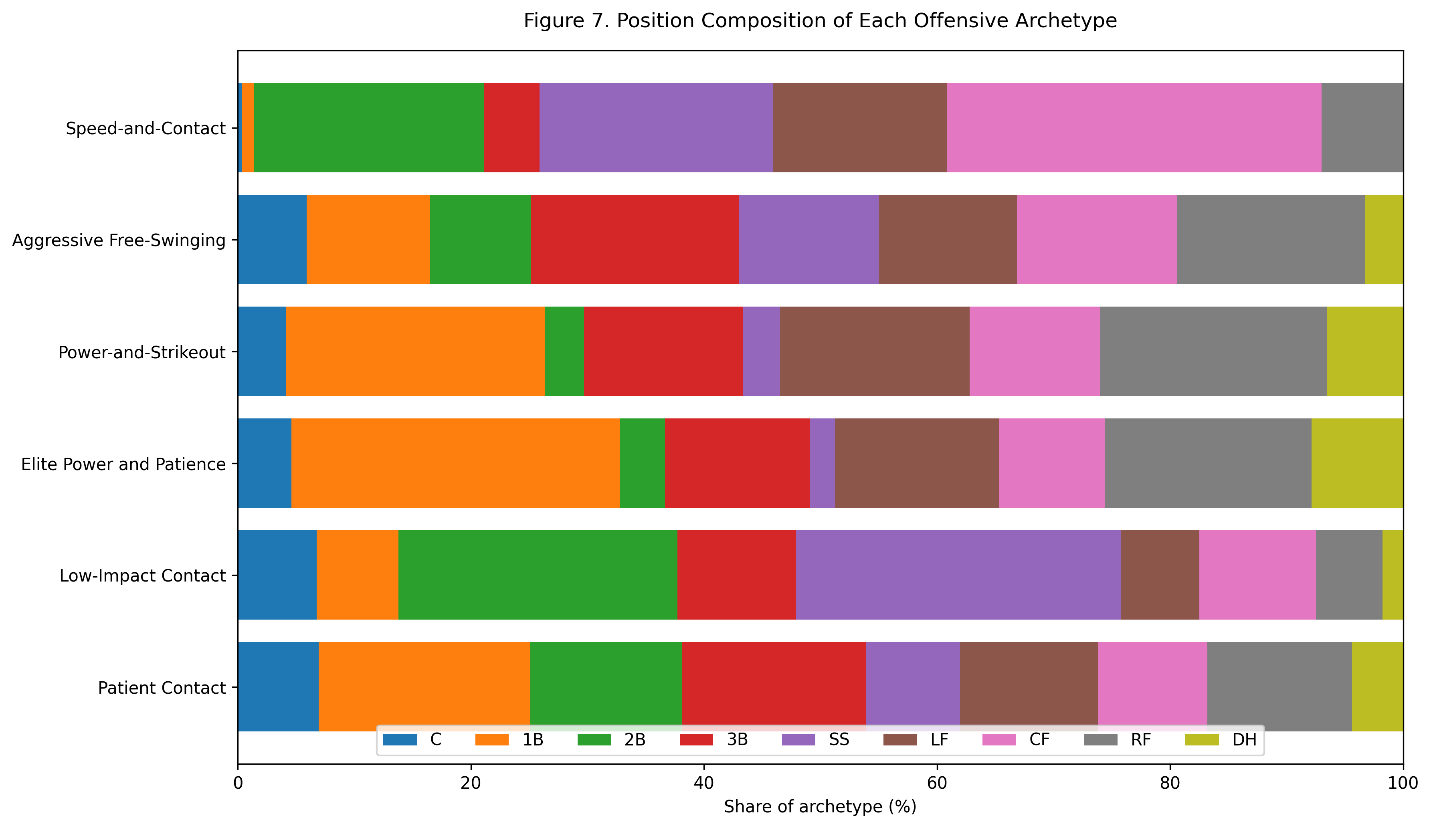
Figure 7. Primary defensive positions represented within each offensive archetype.
The elite power-and-patience cluster was concentrated at traditional offensive positions:
- 28.2 percent first basemen
- 17.7 percent right fielders
- 14.1 percent left fielders
- 12.5 percent third basemen
Shortstops represented only 2.1 percent of the cluster.
The power-and-strikeout group followed a similar pattern. First base, right field, and left field accounted for a large portion of those seasons.
The speed-and-contact cluster looked completely different:
- 32.1 percent center fielders
- 20.0 percent shortstops
- 19.7 percent second basemen
- 15.0 percent left fielders
Catchers and first basemen were almost absent.
The low-impact contact group was strongly concentrated in the middle infield:
- 27.9 percent shortstops
- 23.9 percent second basemen
This pattern reflects the interaction between offense and defensive value. A shortstop could remain in a lineup with limited power because his defensive position carried different offensive expectations. A first baseman generally needed much greater offensive production.
The archetypes are therefore not purely hitting categories. They also reflect the way teams distribute offensive and defensive responsibilities across the field.
What the PCA Map Really Shows
The PCA figure is not simply a picture of six boxes.
Instead, it shows a continuous offensive landscape.
The elite power-and-patience hitters occupy the high end of the first principal component because they combine OBP, power, and walks.
The power-and-strikeout hitters move upward on the second component because of their combination of ISO and strikeout rate.
The speed-and-contact hitters move in the opposite direction because their offensive identities are dominated by baserunning and lower power.
The patient-contact and low-impact contact groups overlap along the contact dimension, but separate sharply through OBP and walk rate.
This provides a useful reminder about classification. A player’s archetype is not his complete identity. It is a summary of how his season relates to thousands of other seasons in baseball history.
Some players sit close to a cluster center. Others occupy transitional areas between types.
Limitations
This study has several important limitations.
First, the model uses traditional Lahman statistics. It does not include park-adjusted measures such as wRC+, nor does it include Statcast measures such as exit velocity, barrel rate, launch angle, or sprint speed.
Second, the model treats each player-season as an independent observation. A player who qualified in 15 seasons appears 15 times. This is appropriate for studying the distribution of seasonal styles, but it gives durable players more influence than short-career players.
Third, the cluster labels are interpretations. The algorithm identifies groups of seasons that are statistically similar. It does not name those groups.
Fourth, the sample includes only qualified hitters. Part-time players, platoon specialists, defensive replacements, and many late-career seasons are excluded.
Fifth, seasonal standardization intentionally removes changes in the league-wide baseline. This is the correct approach for identifying relative archetypes, but it means the clusters should not be interpreted as absolute comparisons of offensive production.
A power-and-strikeout hitter from 1960 did not necessarily strike out as frequently as a member of the same cluster in 2025. He struck out frequently relative to the hitters around him.
Conclusion
I began this study expecting to find a succession of offensive types.
I expected contact hitters to dominate the early years, speed players to expand during the 1970s and 1980s, and power-and-strikeout hitters to overwhelm the modern period.
Some of those movements are visible, but the broader result is more interesting.
Baseball’s offensive environment changed enormously. Its fundamental player archetypes changed much less.
The low-strikeout hitter did not disappear. His raw strikeout rate simply rose with the league.
The power-and-strikeout hitter did not suddenly appear in the twenty-first century. Earlier versions existed within lower-strikeout environments.
The speed-and-contact player did not vanish during the power era. His share remained more stable than the raw stolen-base totals might suggest.
Perhaps the evolution of the baseball player is not a story of one species replacing another.
Perhaps it is a story of persistent roles adapting to a changing environment.
The game changes its equilibrium. The players reorganize themselves around it. Yet the same broad offensive strategies continue to reappear, season after season and generation after generation.
That continuity may be one of the most striking features of baseball history.