WHIP may be one of baseball’s most intuitive pitching statistics.
It asks a straightforward question: how many runners does a pitcher allow to reach base by hit or walk per inning pitched?
\mathrm{WHIP}=\frac{BB+H}{IP}Lower is better.
There is an appealing logic to the statistic. A pitcher who keeps runners off base should allow fewer runs. A pitcher who repeatedly permits hits and walks should eventually pay for them.
And, within a single season, that logic works remarkably well.
But prediction is a different problem.
The fact that WHIP describes a pitcher’s current performance does not necessarily mean that it tells us much about what he will do next year.
So I wanted to test a more difficult question:
How predictive is WHIP?
The Data
I used the season-level FanGraphs data covering 2002 through 2025. The exports include season, innings pitched, ERA, FIP, xFIP, WAR, BABIP, and related measures. A second export supplies the underlying hits and walks needed to examine the components of WHIP. The rate-statistics file contains WHIP itself along with K%, BB%, K-BB%, ERA-, FIP-, xFIP-, FIP, xFIP, and SIERA.
I imposed a minimum of 100 innings:
IP_{i,y}\geq100That produced 1,699 qualifying pitcher-seasons.
For the year-to-year analysis, a pitcher had to reach 100 innings in consecutive seasons:
IP_{i,y}\geq100\quad\text{and}\quad IP_{i,y+1}\geq100That left 927 consecutive-season pairs involving 299 different pitchers.
The shortened 2020 season effectively drops out under this rule. I also checked a less restrictive version allowing the following season to fall below 100 innings. The conclusions barely changed, so the principal findings are not an artifact of the cutoff.
First, Does WHIP Describe Current Performance?
Very much so.
The relationship between WHIP and same-season ERA is striking.
Figure 1. Same-Season WHIP and ERA
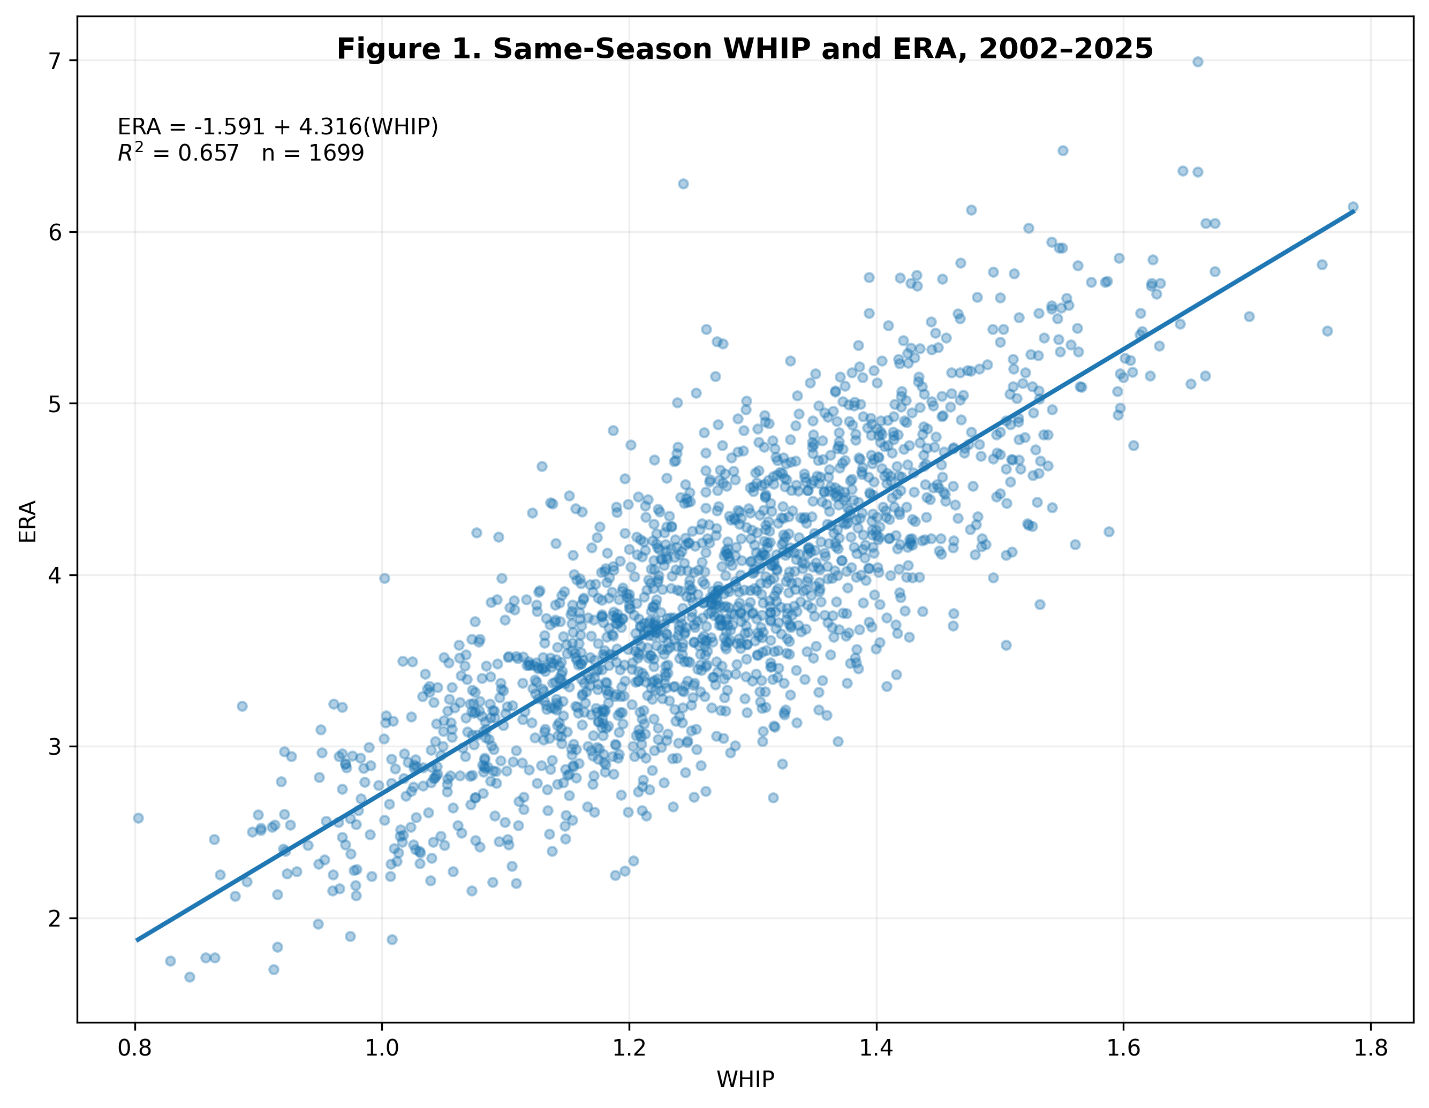
The fitted relationship is:
\mathrm{ERA}=-1.591+4.316(\mathrm{WHIP})with:
R^2=0.657The correlation is approximately:
r=0.811So WHIP explains about 65.7 percent of the observed variation in same-season ERA among these pitcher-seasons.
That is enormous for such a simple statistic.
This should not be surprising. Runs require baserunners, and WHIP measures two of the principal ways pitchers put those runners on base.
But this is description, not prediction.
The real test begins when we move forward one year.
Does WHIP Repeat Itself?
Before asking whether WHIP predicts ERA, it makes sense to ask an even simpler question.
Does a pitcher’s WHIP this year predict his WHIP next year?
Figure 2. Year-to-Year WHIP
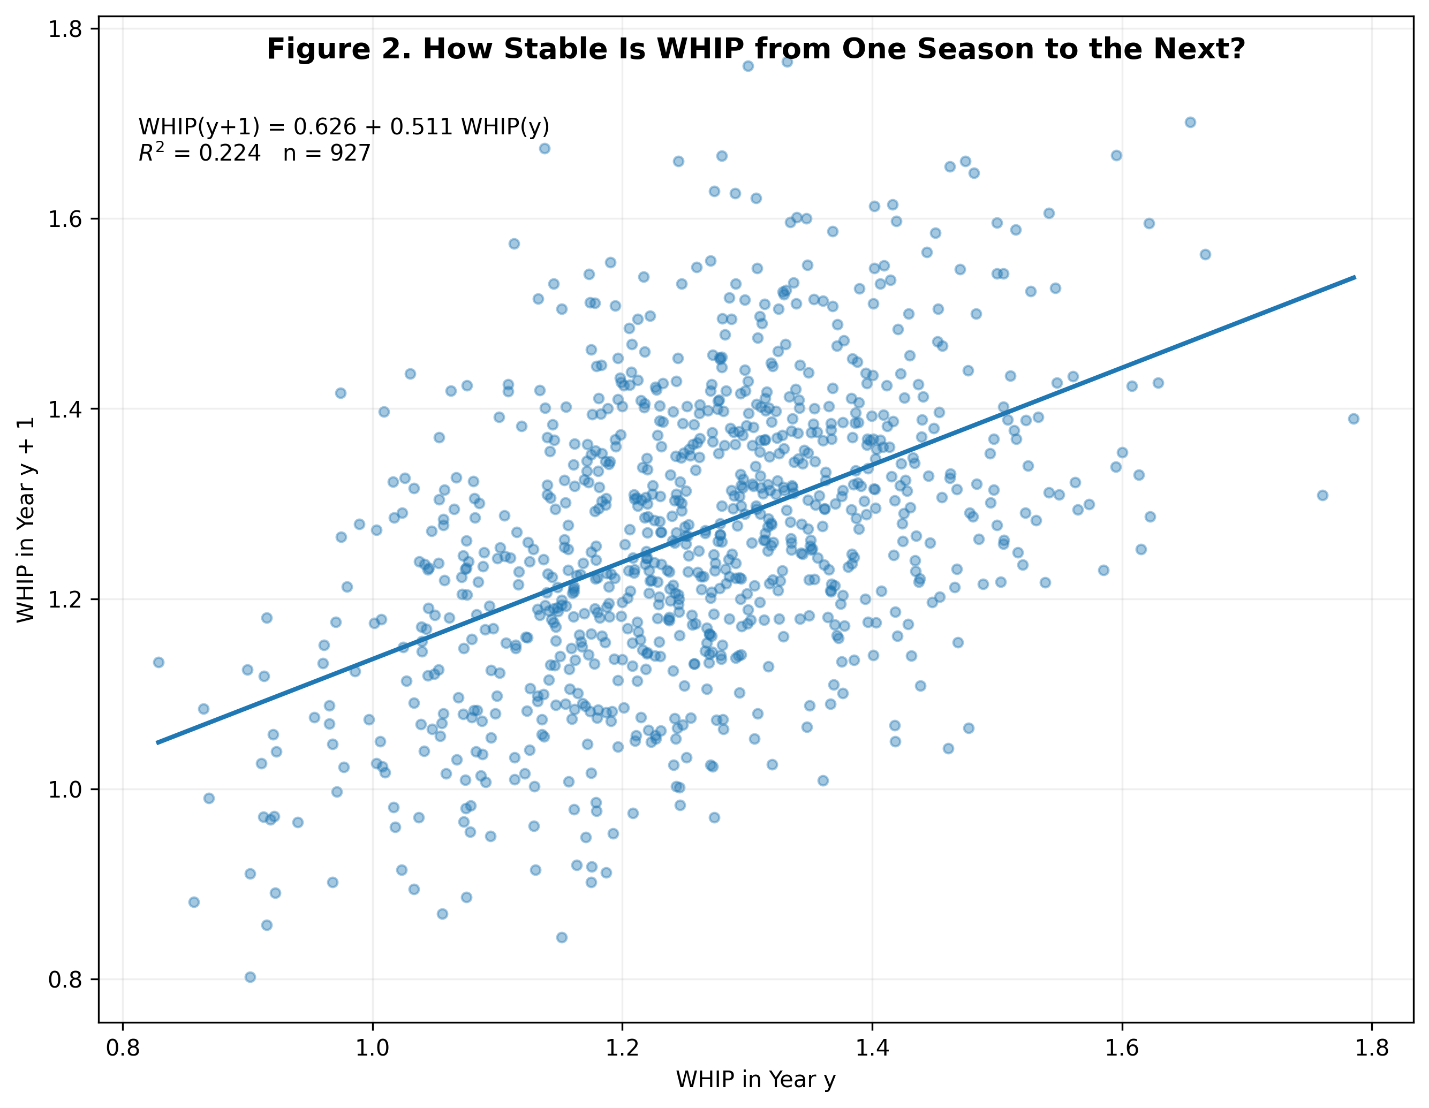
The regression is:
\mathrm{WHIP}_{y+1}=0.626+0.511(\mathrm{WHIP}_{y})with:
R^2=0.224The year-to-year correlation is approximately 0.474.
That is meaningful.
Pitchers with low WHIPs tend to have relatively low WHIPs again. Pitchers with high WHIPs tend to remain higher.
But look at what happened to the explanatory power.
Same season:
R2=0.657
Next season:
R2=0.224
More than two-thirds of WHIP’s apparent explanatory power disappears when we move the target forward one season.
That is our first indication of regression toward the mean.
The Main Question: Does WHIP Predict Next-Season ERA?
Now we come to the central test.
Figure 3. WHIP and Next-Season ERA
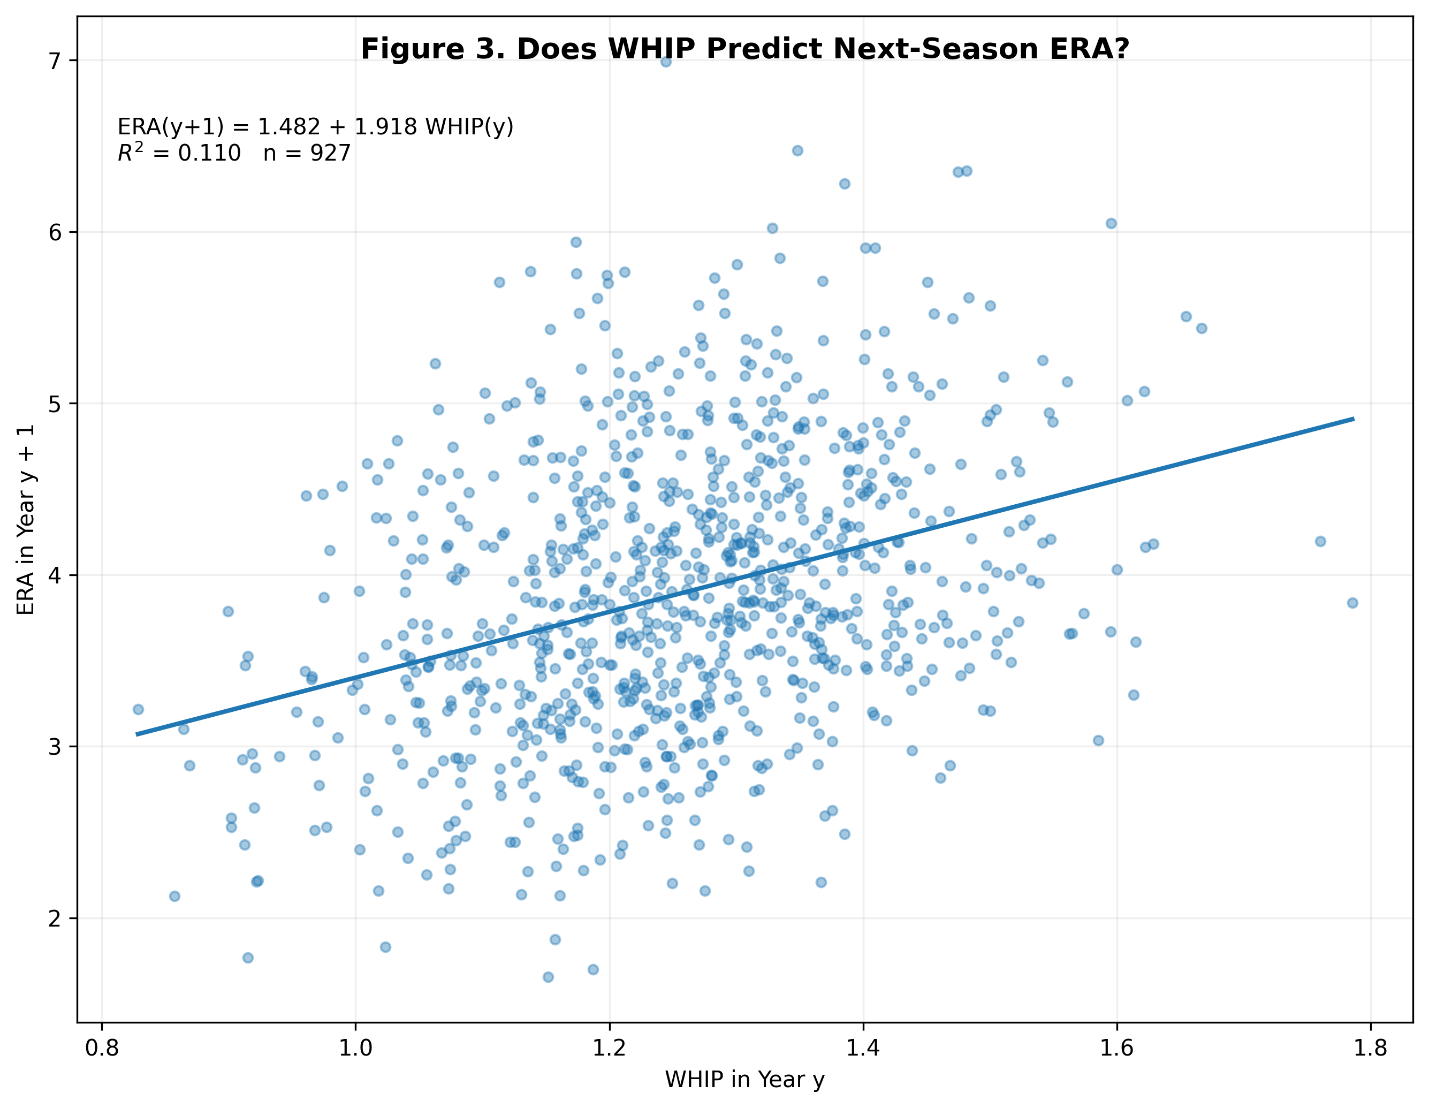
The fitted equation is:
\mathrm{ERA}_{y+1}=1.482+1.918(\mathrm{WHIP}_{y})with:
R^2=0.110The correlation is approximately 0.332.
So current WHIP explains only about 11 percent of the variation in next-season ERA.
That is not nothing.
WHIP contains a real signal.
But compare 11 percent with the 66 percent relationship between WHIP and ERA in the same season.
That difference is the heart of the study.
WHIP is much better at telling us what has happened than telling us what will happen.
How Does WHIP Compare With Other Predictors?
This is where the result becomes more interesting.
I compared several current-season statistics as predictors of next-season ERA:
| Current-season statistic | Leave-one-season-out predictive (R2) |
|---|---|
| SIERA | 0.206 |
| FIP | 0.199 |
| xFIP | 0.195 |
| K-BB% | 0.178 |
| ERA | 0.116 |
| WHIP | 0.101 |
| BABIP | -0.012 |
For this comparison, I used leave-one-season-out validation. Each season was withheld in turn, the regression was estimated using the other seasons, and predictions were generated for the season that had not been used to fit the model.
That makes this a considerably tougher test than simply reporting an in-sample correlation.
Figure 4. Which Statistic Predicts Next-Season ERA Best?
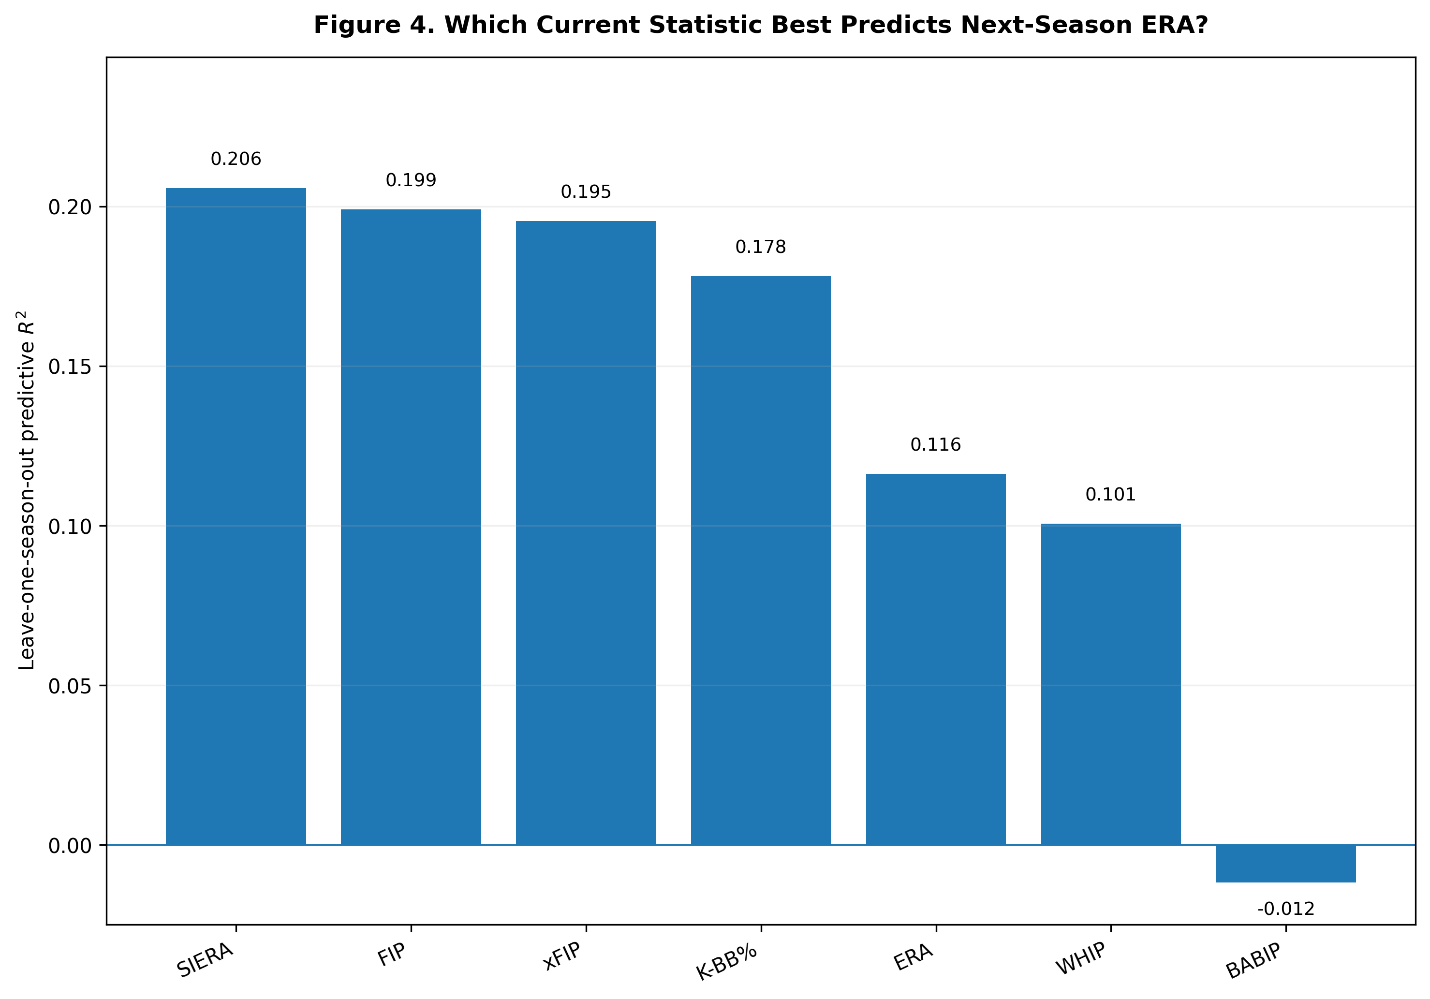
SIERA wins.
FIP and xFIP are essentially right behind it.
K-BB% performs surprisingly well considering how simple it is.
Current ERA beats WHIP, although not by much.
And BABIP is essentially useless for predicting next-season ERA in this sample. Its cross-validated (R^2) is actually slightly below zero, meaning that simply predicting the overall mean would perform marginally better.
This ranking makes baseball sense.
FIP, xFIP, and SIERA deliberately concentrate more heavily on pitcher-controlled characteristics such as strikeouts, walks, and home runs.
WHIP includes hits.
That is both its strength and its weakness.
Hits matter enormously right now.
They are less stable going forward.
Regression Toward the Mean
One of the clearest ways to see the problem is to divide the pitchers into five groups based on their WHIP in year (y).
Figure 5. WHIP Quintiles and Regression Toward the Mean
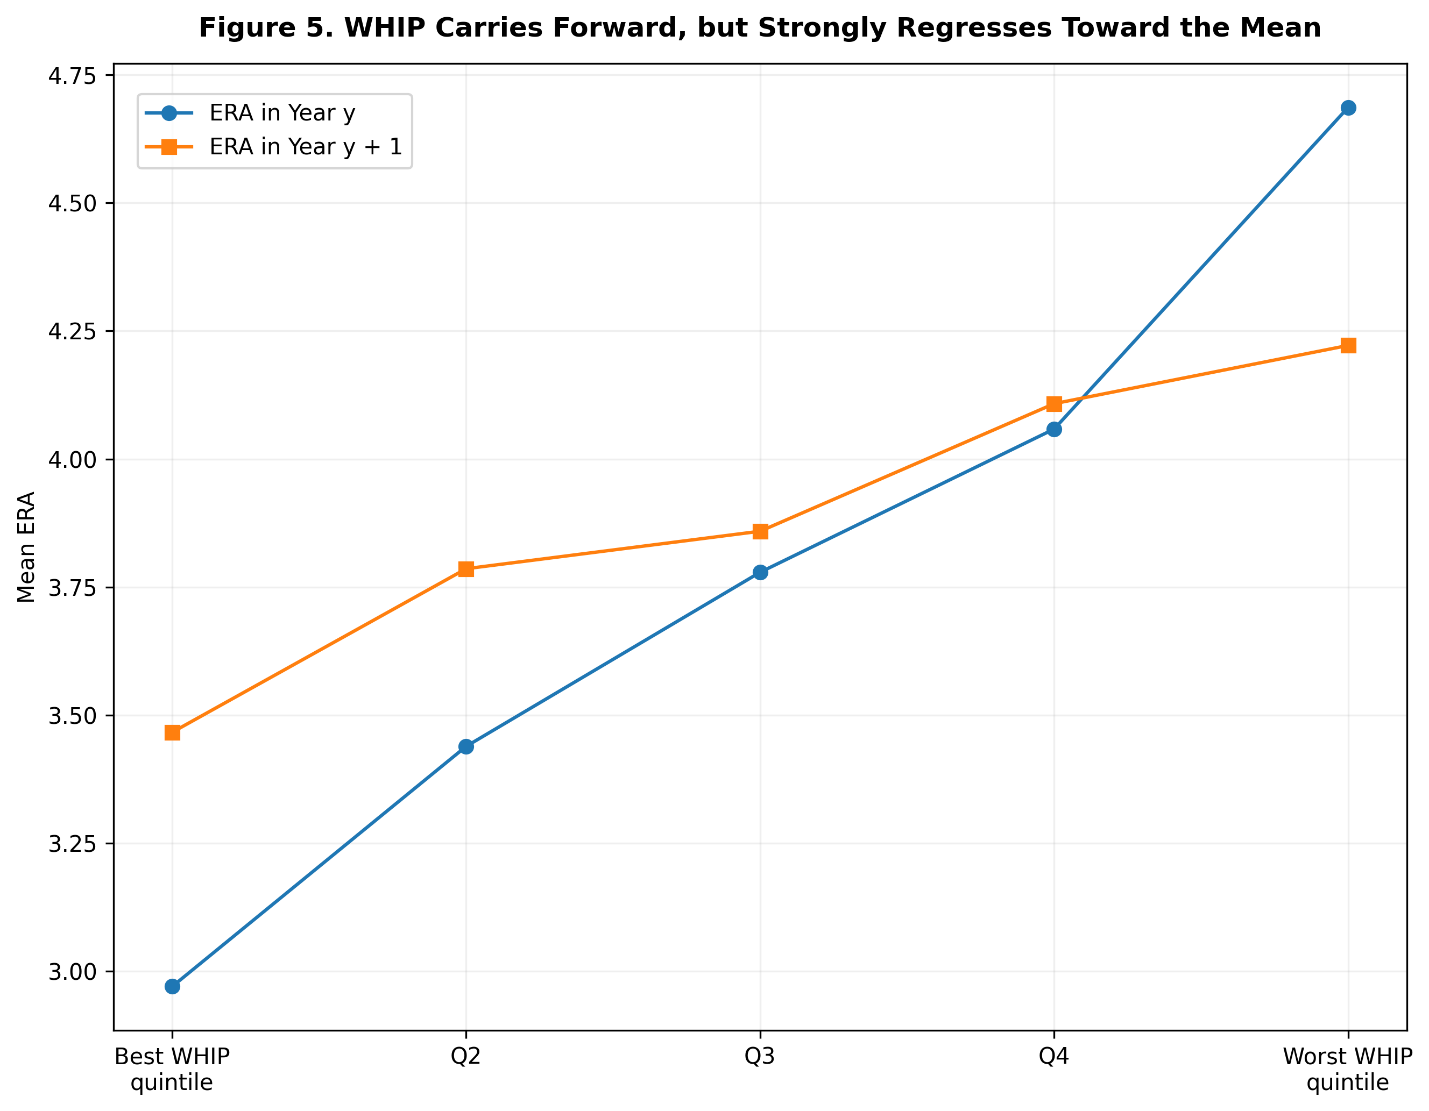
The best-WHIP quintile averaged approximately:
1.054 WHIP and 2.97 ERA in the current season.
Their average ERA the following year?
3.47.
That is still very good, but nowhere near 2.97.
At the other extreme, the worst-WHIP quintile averaged approximately:
1.454 WHIP and 4.69 ERA.
The following season their ERA improved to approximately:
4.22.
The extremes move toward one another.
The spread between the best and worst groups was about 1.72 ERA runs in year (y).
One season later, it was only about 0.76 runs.
WHIP clearly contains information that persists.
It simply does not persist nearly as strongly as the current-season relationship might lead us to believe.
Which Part of WHIP Is Responsible?
WHIP consists of two pieces:
\mathrm{WHIP}=\frac{H}{IP}+\frac{BB}{IP}That gives us a useful experiment.
We can separate hits from walks.
Using per-nine-inning versions:
H/9=9\left(\frac{H}{IP}\right)and:
BB/9=9\left(\frac{BB}{IP}\right)The results contain a small surprise.
Figure 6. What Part of WHIP Persists?
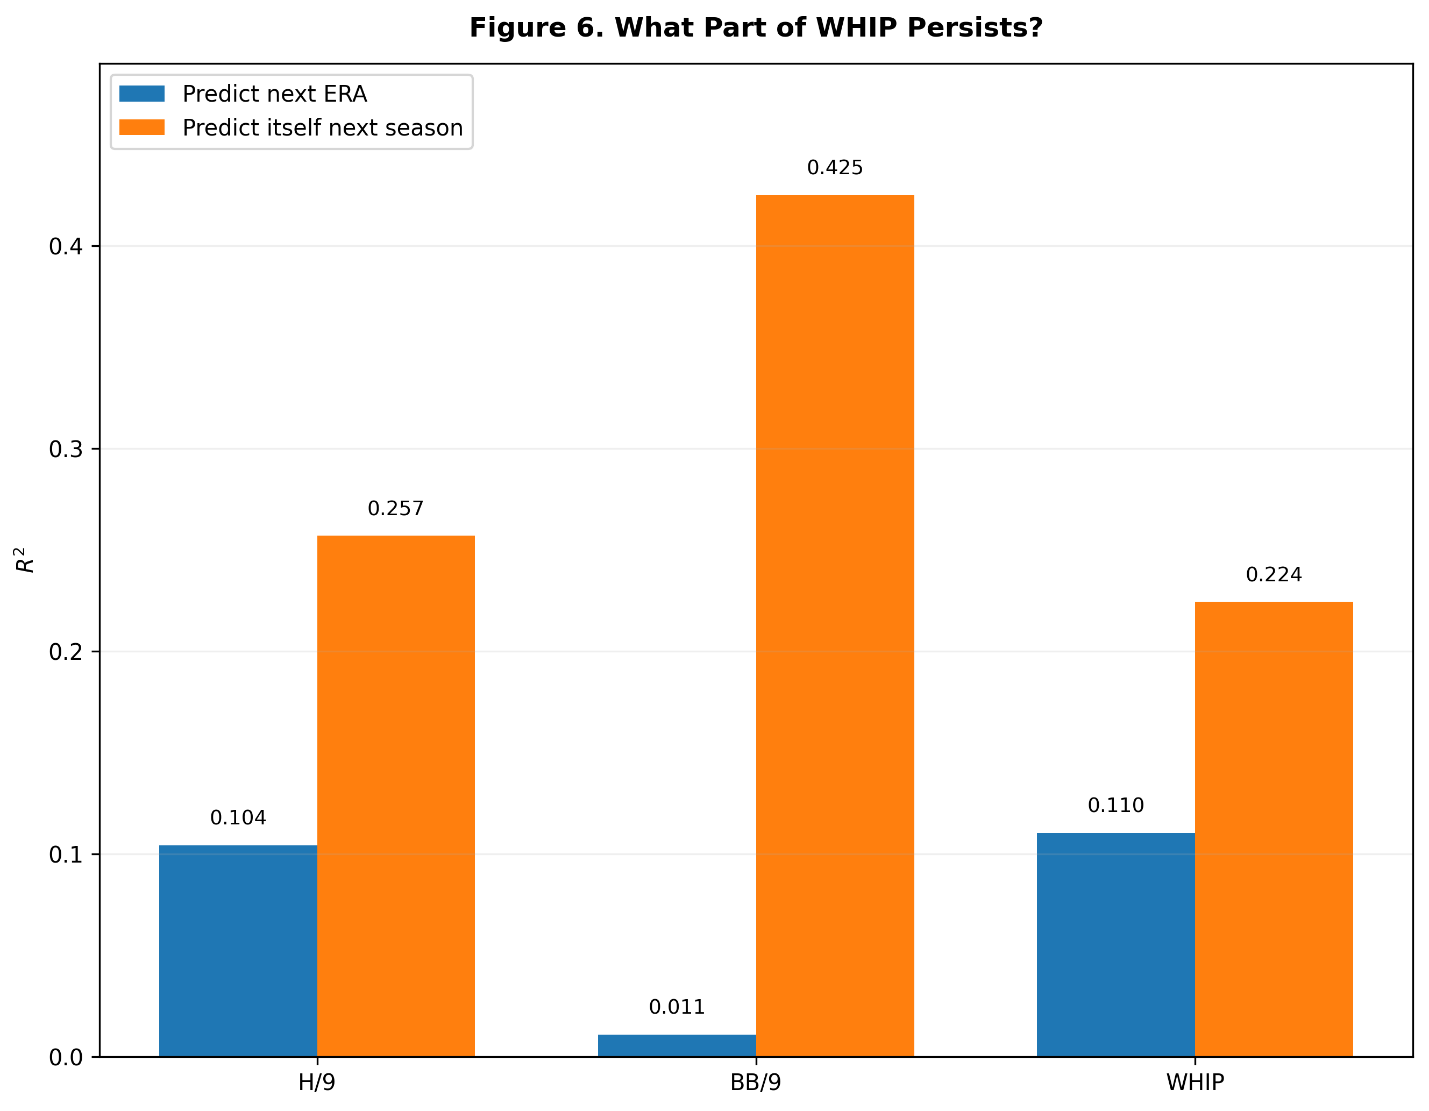
BB/9 is actually the most stable individual component from one year to the next.
Its year-to-year (R2) is approximately:
0.425
H/9 has a year-to-year (R2) of about:
0.257
and WHIP itself:
0.224
So walk rate is considerably more persistent than hit rate.
But when the target is next-season ERA, the story reverses.
Current H/9 explains about 10.4 percent of future ERA variation.
Current BB/9 explains only about 1.1 percent.
WHIP explains about 11.0 percent.
That sounds contradictory at first.
It is not.
Walk rate is a repeatable pitcher skill, but within this group of durable pitchers its variation alone does not explain very much of next year’s ERA. Hits allowed are less stable, yet they contain information related to strikeout ability, contact suppression, and other pitcher characteristics.
Importantly, BABIP itself had essentially no relationship with next-season ERA.
So the useful information in H/9 is not simply “this pitcher had a low BABIP, therefore he will again.”
Does WHIP Add Anything to Better Pitching Metrics?
This may be the most revealing test of all.
Suppose we already know a pitcher’s FIP or SIERA.
Does knowing his WHIP improve our prediction?
Figure 7. Does WHIP Add Predictive Information?
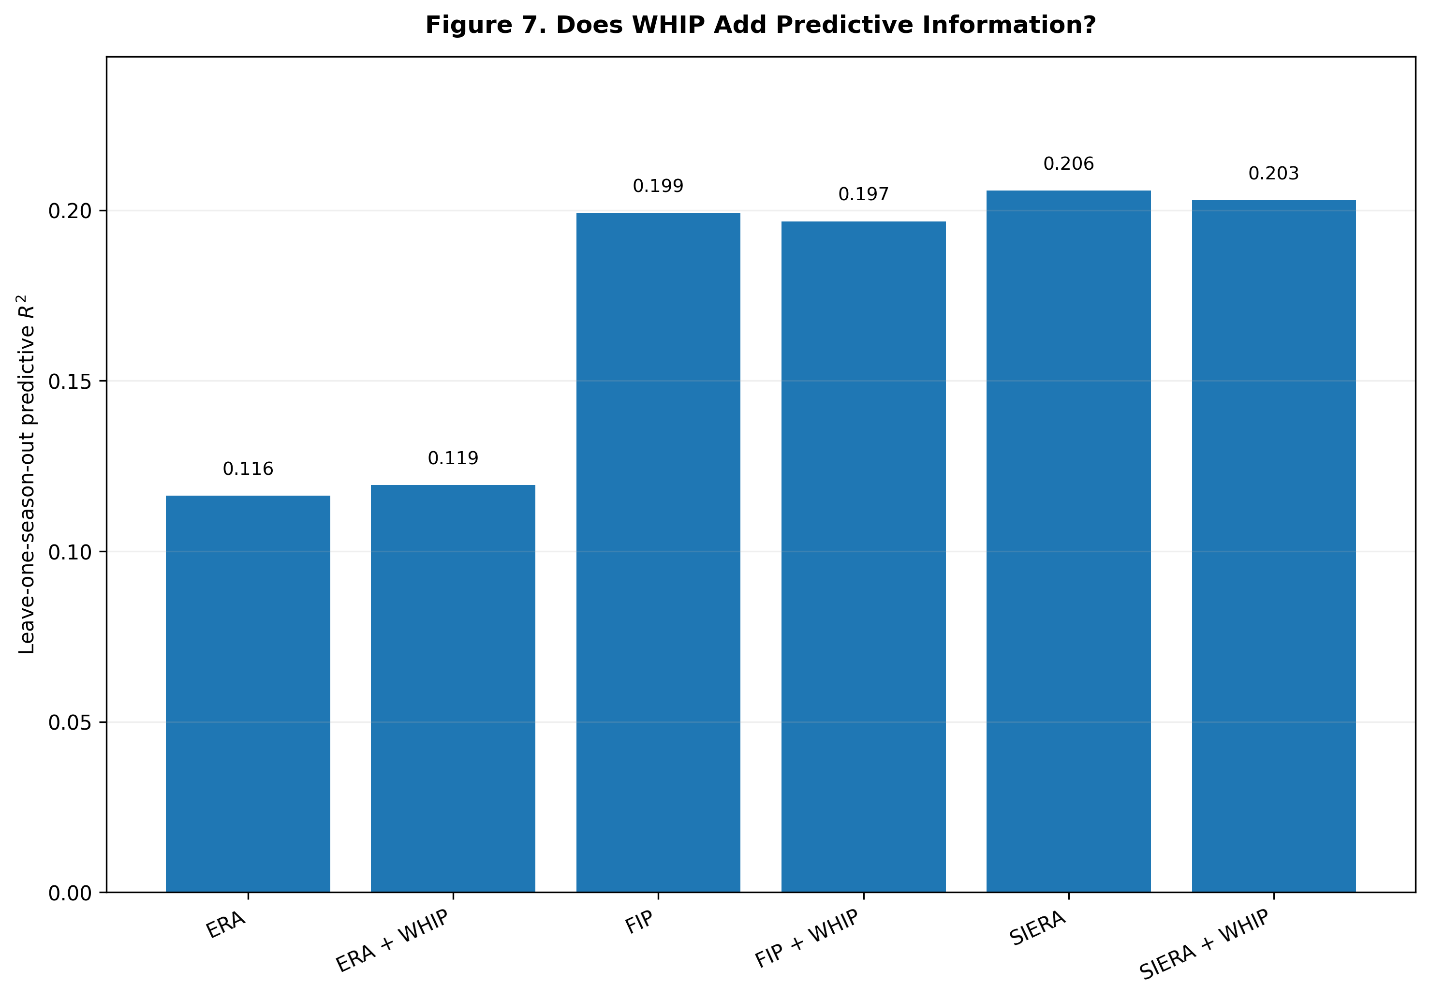
The answer is essentially no.
The leave-one-season-out results were approximately:
| Model | Predictive (R2) |
|---|---|
| ERA | 0.116 |
| ERA + WHIP | 0.119 |
| FIP | 0.199 |
| FIP + WHIP | 0.197 |
| SIERA | 0.206 |
| SIERA + WHIP | 0.203 |
Adding WHIP to ERA produces a tiny improvement.
Adding WHIP to FIP actually lowers out-of-sample performance slightly.
Adding it to SIERA does the same.
That does not mean WHIP is worthless.
It means that once we know a more sophisticated pitcher estimator, WHIP contributes little additional predictive information.
SIERA already knows much of what we need to know about the pitcher’s underlying skills.
WHIP mainly tells us what happened to those skills and batted balls in the season we just observed.
A League-Adjusted Check
There is another potential concern.
Baseball’s run environment changed between 2002 and 2025.
Fortunately, the supplied FanGraphs data also contain ERA-, FIP-, xFIP-, and league-adjusted WHIP+.
Repeating the year-to-year analysis with those adjusted measures does not change the conclusion.
Current WHIP+ explains about 9.4 percent of next-season ERA- variation.
Current ERA- explains about 10.1 percent.
FIP- rises to roughly 17.6 percent, while xFIP- reaches approximately 17.9 percent.
The same hierarchy remains.
The finding is therefore not merely the result of changing league scoring environments.
What WHIP Is Good For
None of this makes WHIP a bad statistic.
Quite the opposite.
A statistic explaining roughly 66 percent of the variation in same-season ERA with a formula consisting only of hits, walks, and innings is extraordinarily efficient.
WHIP answers a very useful question:
How successfully has this pitcher kept runners off base?
It is easy to calculate.
Easy to understand.
Easy to compare.
And strongly connected to what happened on the scoreboard.
But a descriptive statistic and a predictive statistic are not the same thing.
That distinction matters.
FIP, xFIP, SIERA, and K-BB% sacrifice some of WHIP’s intuitive simplicity in an attempt to isolate skills that are more likely to persist.
Our results suggest that tradeoff works.
Conclusion
WHIP passes one test spectacularly and another only modestly.
As a description of current performance, it is excellent.
R^2_{\mathrm{WHIP,\ same\ season\ ERA}}=0.657
As a predictor of its own next-season value:
R^2_{\mathrm{WHIP}_y,\mathrm{WHIP}_{y+1}}=0.224
And as a predictor of next-season ERA:
R^2_{\mathrm{WHIP}_y,\mathrm{ERA}_{y+1}}=0.110
Under the stricter leave-one-season-out test, that last value falls slightly to about 0.101.
SIERA roughly doubles that predictive performance.
FIP and xFIP come close.
K-BB% also comfortably beats WHIP.
So the answer to the original question is fairly clear.
WHIP is predictive, but not especially predictive.
A low WHIP today is meaningful evidence that a pitcher will perform well tomorrow. It is simply much weaker evidence than its strong relationship with today’s ERA might suggest.
That may be WHIP’s most interesting characteristic.
It looks like a forward-looking statistic because it is so closely connected with pitching success.
In reality, much of its power belongs to the present.
WHIP tells us exceptionally well what a pitcher has done.
For predicting what he will do next, we can do better.