Money Helps, but Not as Much as You Might Think: MLB Payroll and Wins in 2026
Baseball has always lived with an uncomfortable question: how many wins can a team buy?
The 2026 season gives us another opportunity to look at that question. Using Spotrac’s total payroll allocations for all 30 MLB teams and each club’s final win total, we can compare spending directly with performance.
The relationship exists, barely. It is not particularly strong.
The average MLB payroll in 2026 was approximately $183.4 million, while the median was about $171.5 million. At the extremes, the Dodgers spent roughly $380.4 million, while Cleveland operated with only $79.3 million.
Yet those differences in spending did not translate neatly into differences in wins.
The simple linear regression is:
\mathrm{Wins} = 72.95 + 0.0437 \left( \mathrm{Payroll\ in\ \$Millions} \right)The correlation between payroll and wins was:
r = 0.323and the coefficient of determination was:
R^2 = 0.104In other words, payroll explained only about 10.4 percent of the variation in team wins during the 2026 season. That is surprisingly little.
The regression coefficient provides another way to see it. An additional $100 million in payroll was associated with only about 4.4 additional wins. Even that relationship was not conventionally statistically significant, with .
Figure 1. Payroll and Wins
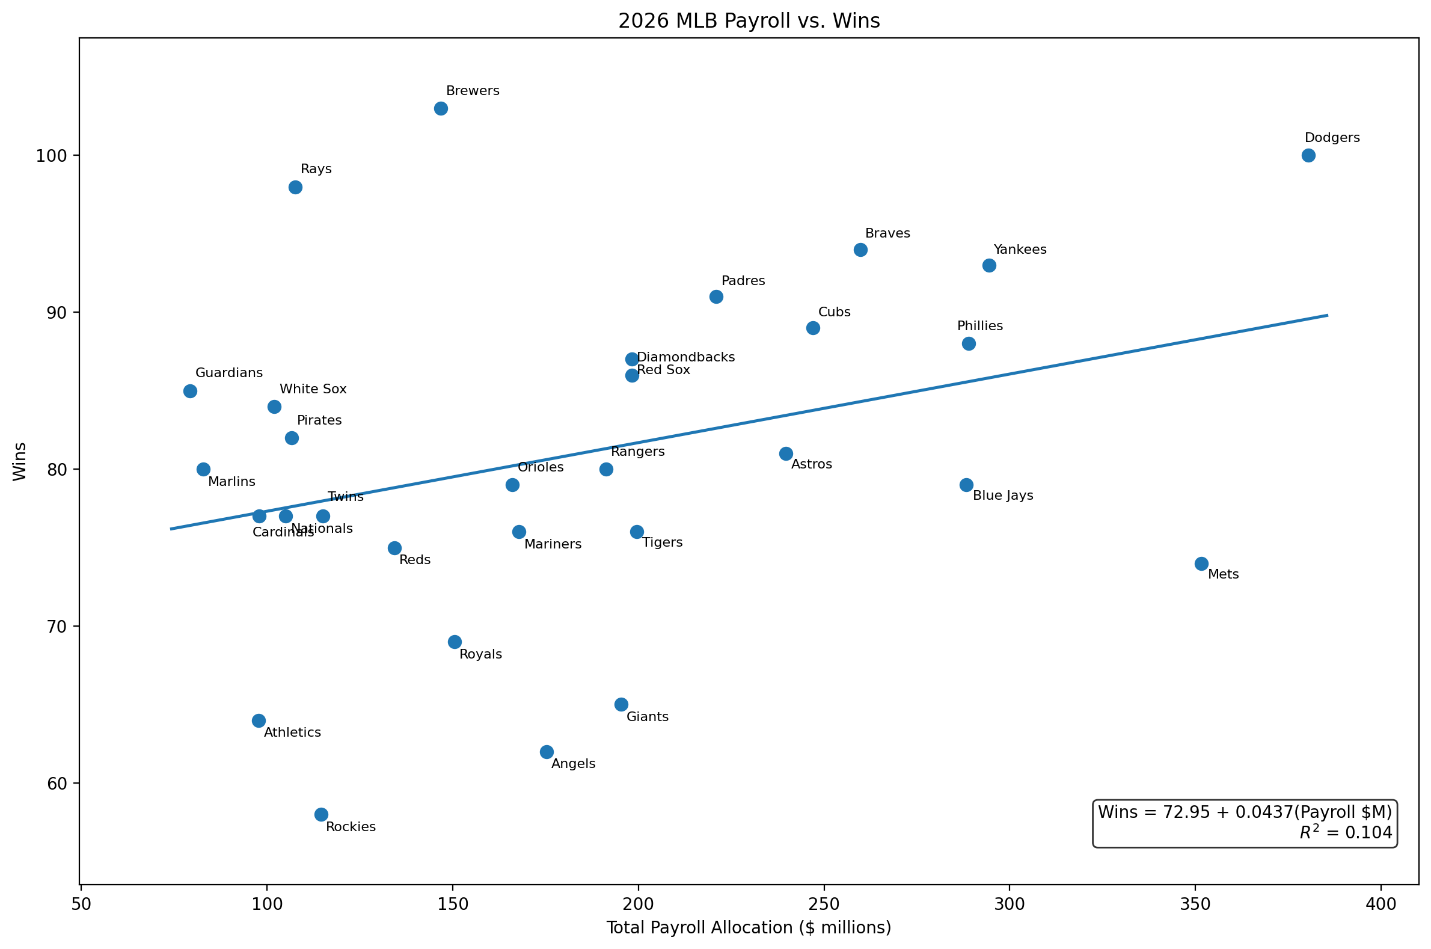
Figure 1 shows why the relationship is so weak. There is a slight upward trend, but the teams are widely scattered around the regression line.
Milwaukee is perhaps the most striking example. The Brewers won 103 games with a payroll of about $146.8 million. Tampa Bay won 98 games while spending only about $107.6 million.
Cleveland provides another interesting case. The Guardians had the lowest payroll in baseball, approximately $79.3 million, yet still won 85 games. At the opposite end, the Mets spent approximately $351.6 million and won only 74 games.
Money is important, but these teams show how much room remains for roster construction, player development, injuries, aging, unexpected breakouts, and simple baseball variance.
Measuring Payroll Efficiency
Rather than simply dividing payroll by wins, we can use the regression model to ask a better question: How many games did a team win compared with the number of wins we would expect from its payroll?
The difference between actual wins and predicted wins is the regression residual.
A positive residual means the team won more games than its payroll would predict. A negative residual means it won fewer.
Figure 2. Wins Above or Below Payroll Expectations
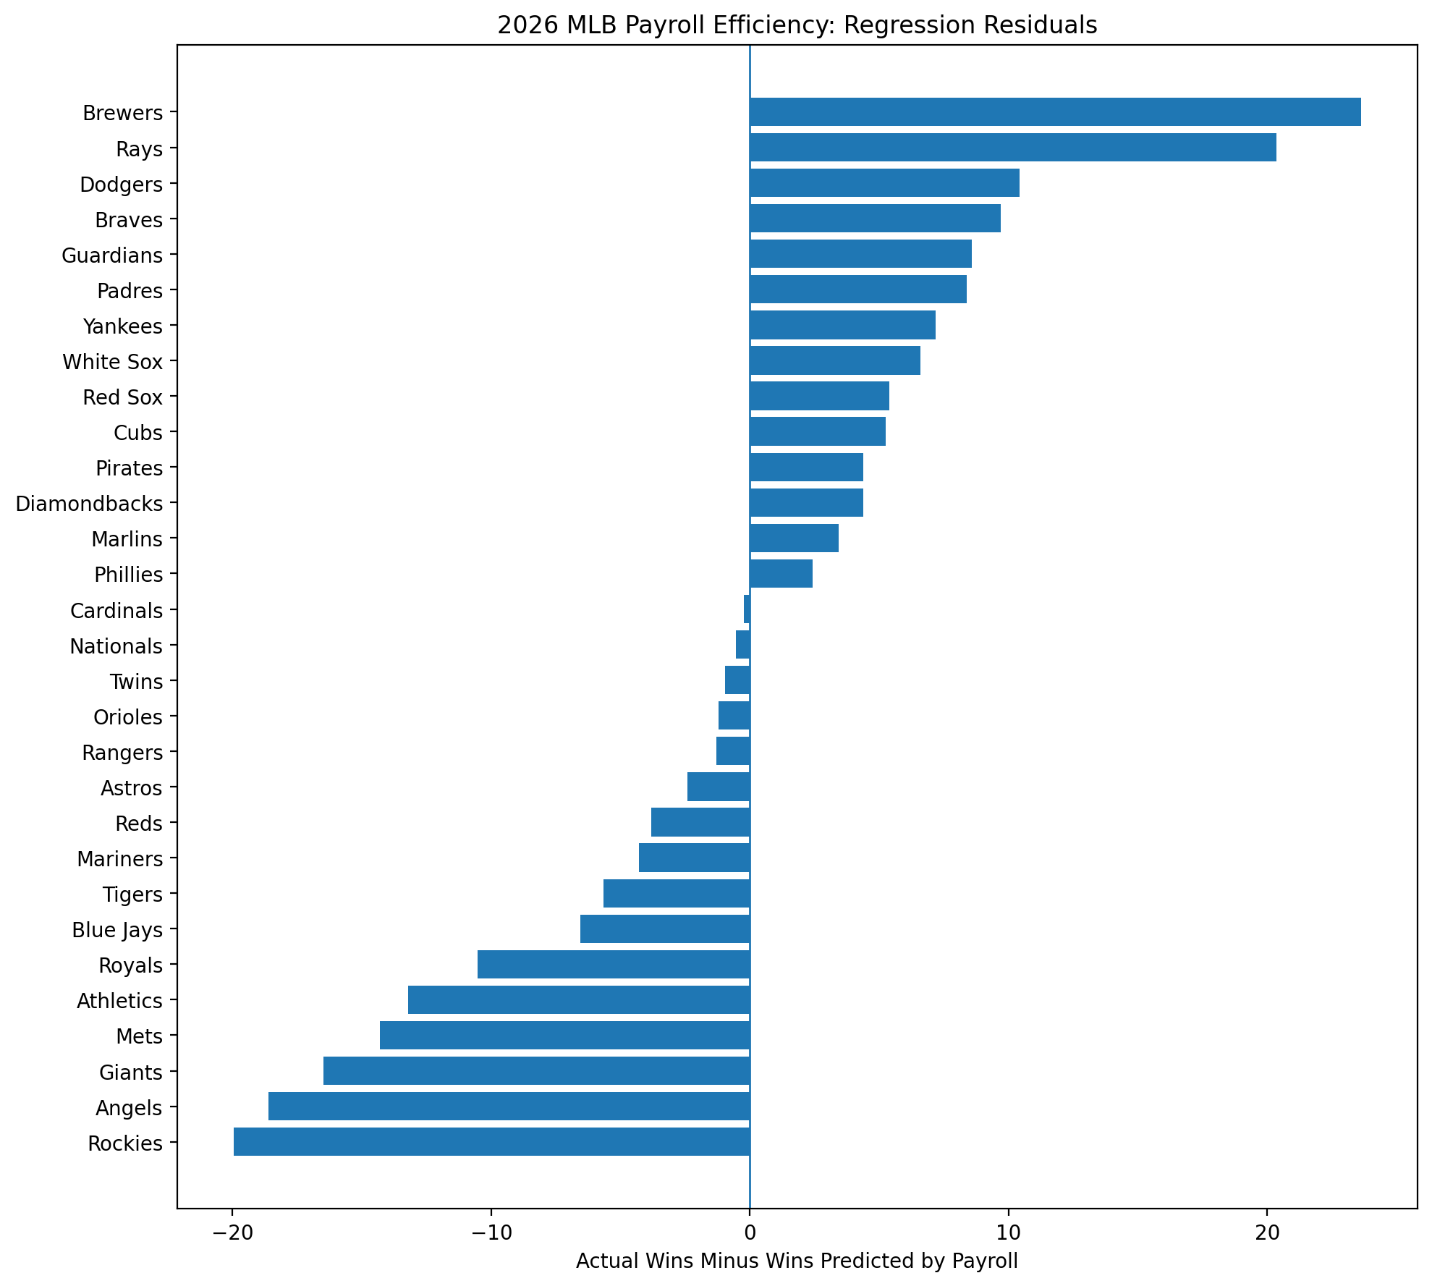
The Brewers were the extraordinary outlier, finishing about 23.6 wins above their payroll-based expectation. Tampa Bay followed at roughly 20.4 wins above expectation.
The Dodgers also performed well relative to their enormous payroll, finishing about 10.4 wins above the regression prediction. Atlanta was about 9.7 wins above expectation, while Cleveland finished approximately 8.6 wins above expectation.
At the other end were Colorado, the Angels, San Francisco, and the Mets. Each won far fewer games than its payroll predicted.
That distinction is noteworthy. A large payroll is not automatically inefficient. The Dodgers spent more than anyone else, but they also won 100 games and substantially exceeded the performance predicted by the league-wide payroll relationship.
Likewise, a small payroll is not automatically efficient. A low-spending team still has to win.
What 2026 Tells Us
The 2026 season reinforces something we have seen repeatedly in studying baseball economics. Payroll establishes possibilities. It does not determine outcomes.
Teams with greater financial resources can purchase more established talent, absorb expensive mistakes, replace injured players, and retain stars. Those advantages are real.
But across MLB in 2026, nearly 90 percent of the variation in wins was associated with factors other than payroll in this simple model.
Milwaukee, Tampa Bay, and Cleveland dramatically exceeded what their payrolls alone would suggest. The Mets demonstrated the opposite problem: enormous financial resources did not translate into comparable success.
For a sport supposedly divided between the rich and everyone else, the 2026 scatterplot is remarkably messy. And that may be the most interesting result of all.