What Did an MLB Win Cost in 2026?
There is another way to look at the relationship between payroll and winning. Instead of asking whether higher payroll produces more victories, we can ask a simpler question: How much did each team spend for each win?
For each club, I calculated:
\mathrm{Payroll\ Cost\ per\ Win} = \frac{\mathrm{Total\ Payroll}}{\mathrm{Wins}}Across the 30 MLB teams in 2026, the average cost was about $2.26 million per win. The median was almost identical at $2.24 million, with a standard deviation of approximately $0.93 million.
But the range was enormous.
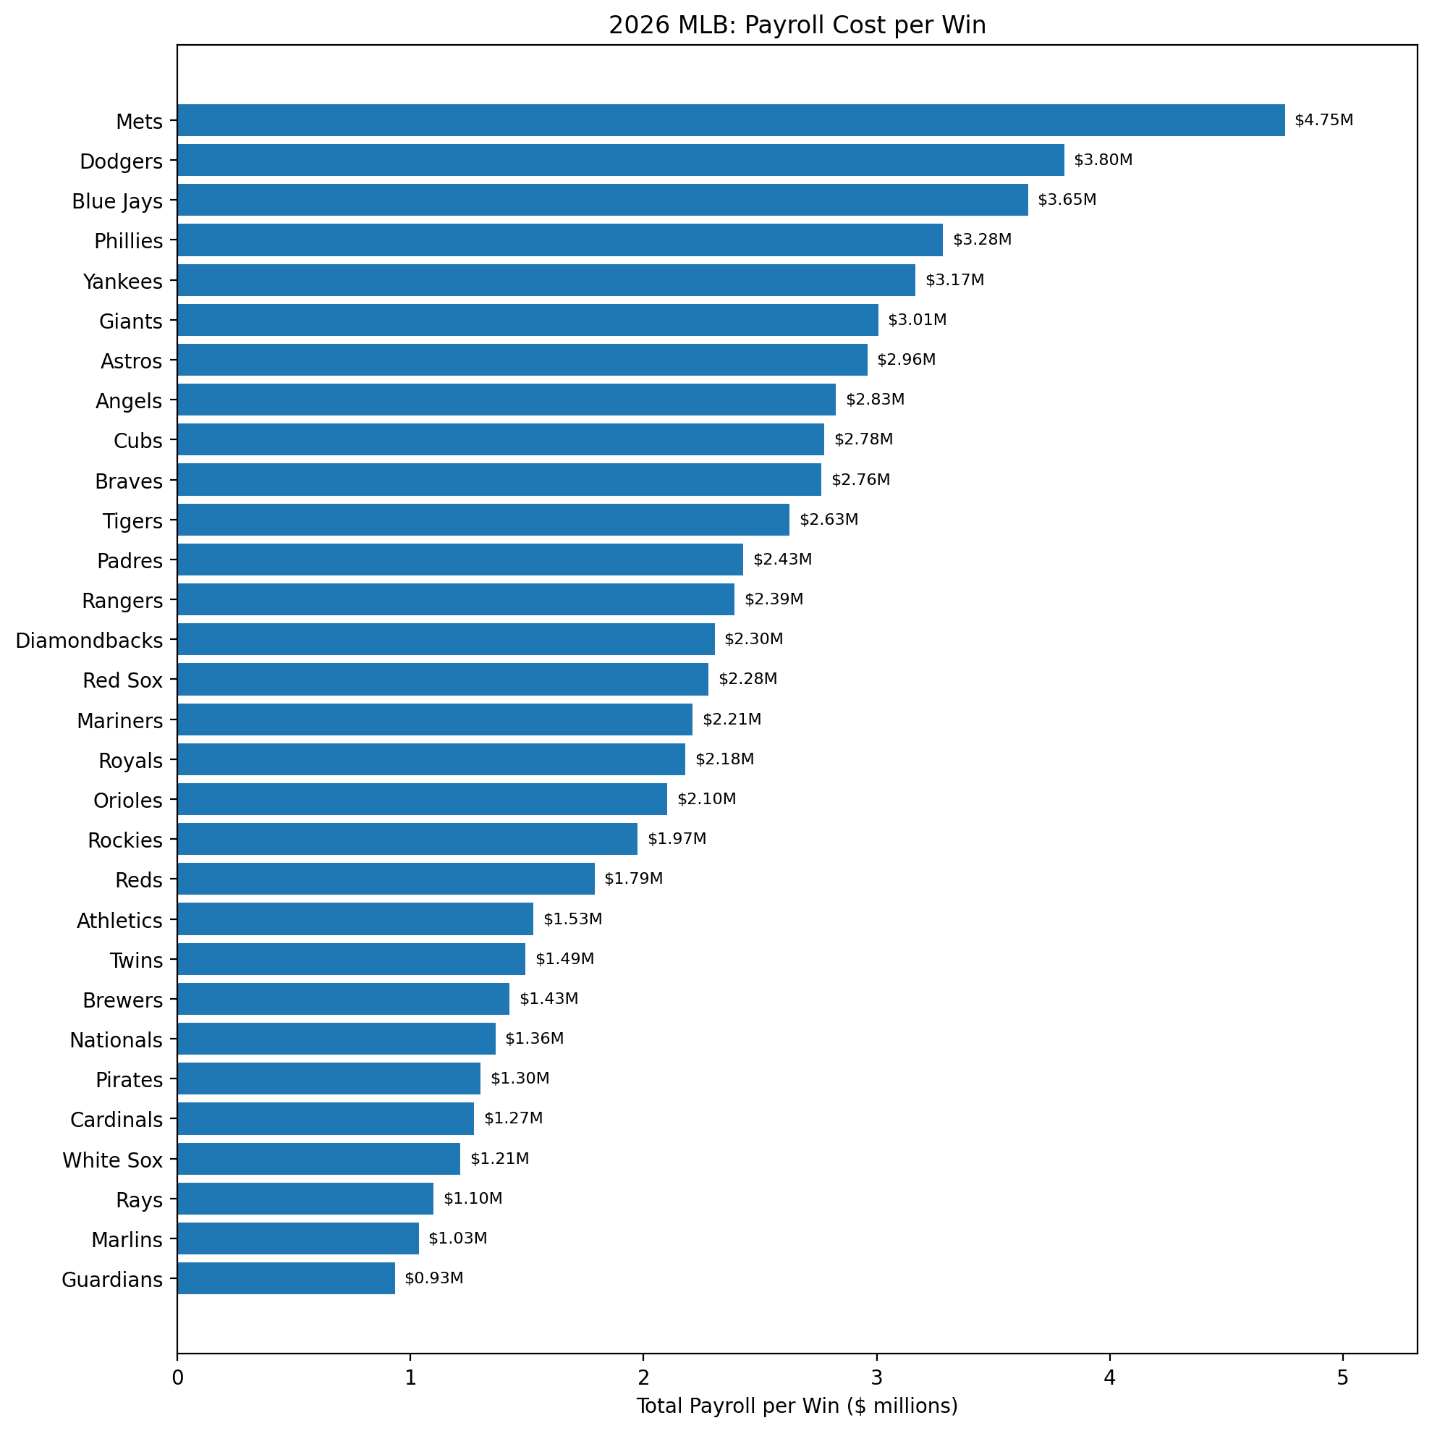
Cleveland (surprised?) produced wins at the lowest monetary cost, spending only about $0.93 million per victory. Miami followed at roughly $1.03 million, with Tampa Bay at $1.10 million.
At the opposite end, the Mets spent approximately $4.75 million for every win. The Dodgers were next at $3.80 million, followed by Toronto at about $3.65 million.
Figure 1. Payroll Cost per Win
The rankings produce some interesting contrasts.
Milwaukee won 103 games while spending only about $1.43 million per win. Tampa Bay won 98 at approximately $1.10 million per win. Cleveland won 85 despite having the lowest total payroll in baseball.
Meanwhile, large payrolls did not necessarily translate into inexpensive victories. The Mets’ $351.6 million payroll combined with only 74 wins produced the highest cost per victory in MLB.
Does Cost per Win Follow a Normal Distribution?
This is where the analysis becomes especially interesting.
The distribution is surprisingly close to a normal distribution, although it has a modest right-hand tail.
The descriptive statistics are:
\mathrm{Mean} = \$2.264\ \mathrm{million} \mathrm{Median} = \$2.244\ \mathrm{million} \mathrm{SD} = \$0.929\ \mathrm{million}The mean and median being so close is our first indication that the distribution is reasonably balanced.
The measured skewness was:
\mathrm{Skewness} = 0.625So the distribution is somewhat right-skewed, largely because of the very expensive wins produced by teams such as the Mets, Dodgers, and Blue Jays.
Figure 2. Distribution of Payroll Cost per Win
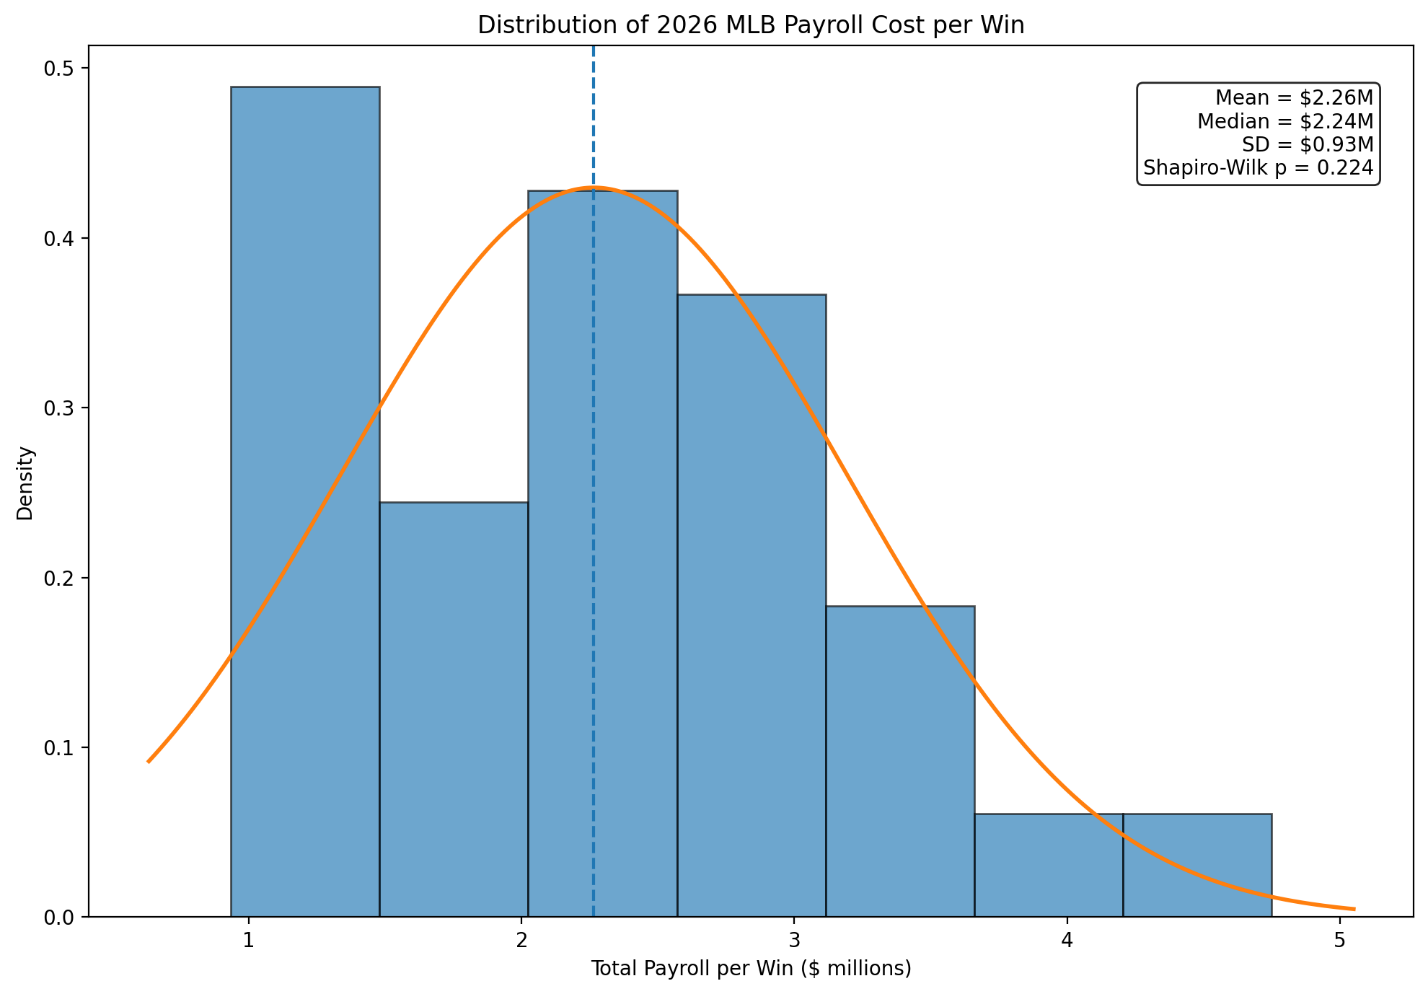
Visually, the normal curve fits the data reasonably well.
More importantly, a Shapiro-Wilk test gives:
W = 0.955 p = 0.224A D’Agostino-Pearson normality test produces a similar result:
p = 0.293Provides sufficient evidence to reject the hypothesis that the 30 values came from a normal distribution.
That does not prove that MLB cost per win is normally distributed. Thirty teams constitute a relatively small sample, and the right tail is clearly visible.
Still, the result is intriguing. For 2026, team spending per victory forms something surprisingly close to the familiar bell-shaped distribution.
Most teams cluster around roughly $1.5 million to $3 million per win, with a few exceptionally inexpensive winners on one side and a few extraordinarily expensive victories on the other.
Perhaps the next question is the most interesting one: does this normal-looking distribution appear every season, or is 2026 unusual?